注意
前往結尾以下載完整的範例程式碼。
使用限制性配置調整軸大小#
限制性配置會嘗試調整圖表中的子圖大小,使軸物件和軸上的標籤之間沒有重疊。
請參閱限制性配置指南以取得更多詳細資料,並參閱緊密配置指南以取得替代方案。
import matplotlib.pyplot as plt


def example_plot(ax):
    ax.plot([1, 2])
    ax.set_xlabel('x-label', fontsize=12)
    ax.set_ylabel('y-label', fontsize=12)
    ax.set_title('Title', fontsize=14)
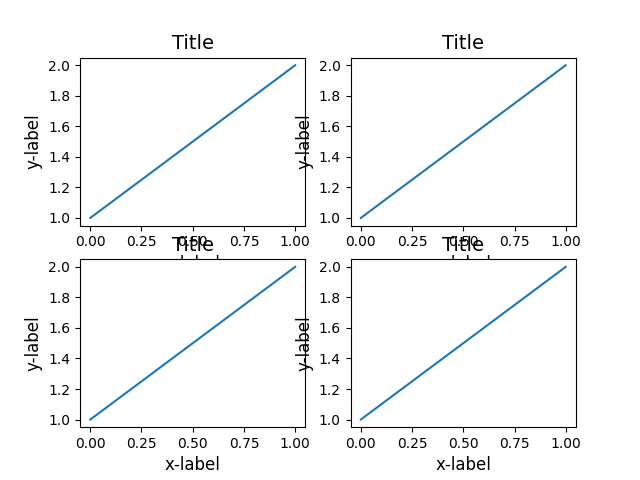
如果我們不使用限制性配置,則標籤會與軸重疊
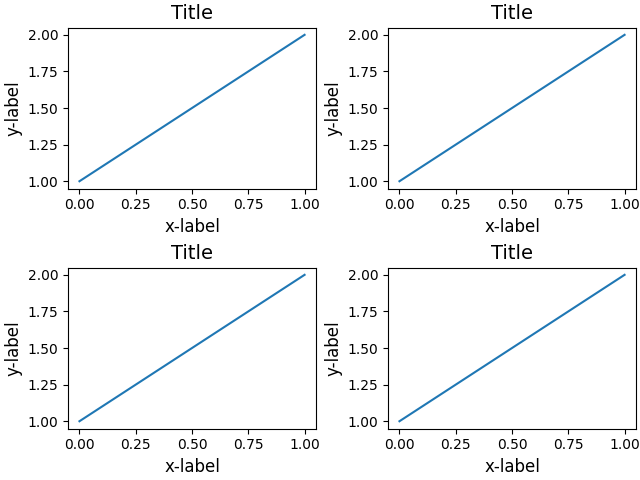
新增 layout='constrained' 會自動調整。
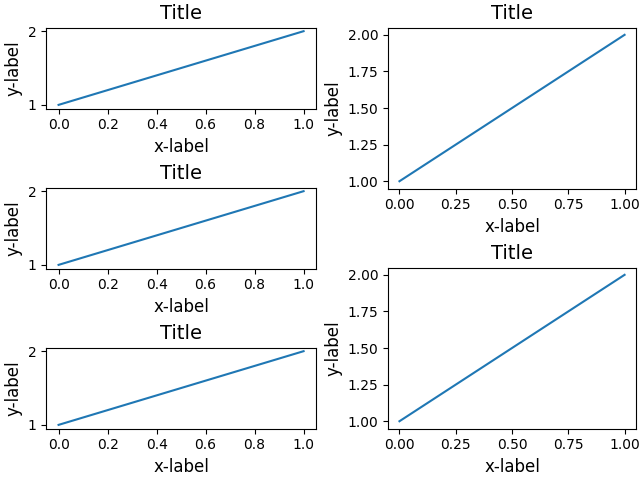
以下是使用巢狀 gridspec 的更複雜範例。
fig = plt.figure(layout='constrained')

import matplotlib.gridspec as gridspec

gs0 = gridspec.GridSpec(1, 2, figure=fig)

gs1 = gridspec.GridSpecFromSubplotSpec(3, 1, subplot_spec=gs0[0])
for n in range(3):
    ax = fig.add_subplot(gs1[n])
    example_plot(ax)


gs2 = gridspec.GridSpecFromSubplotSpec(2, 1, subplot_spec=gs0[1])
for n in range(2):
    ax = fig.add_subplot(gs2[n])
    example_plot(ax)

plt.show()
腳本的總執行時間:(0 分鐘 5.127 秒)