注意
跳至結尾以下載完整的範例程式碼。
線圖#
建立基本線圖。
import matplotlib.pyplot as plt
import numpy as np
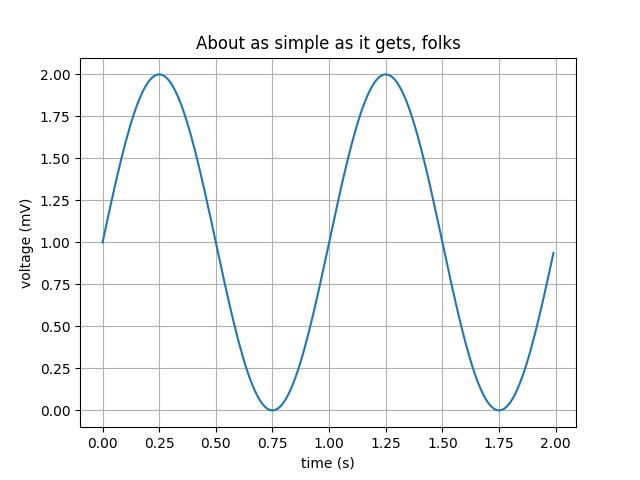
# Data for plotting
t = np.arange(0.0, 2.0, 0.01)
s = 1 + np.sin(2 * np.pi * t)
fig, ax = plt.subplots()
ax.plot(t, s)
ax.set(xlabel='time (s)', ylabel='voltage (mV)',
title='About as simple as it gets, folks')
ax.grid()
fig.savefig("test.png")
plt.show()
參考
本範例顯示了以下函式、方法、類別和模組的使用方式
腳本總執行時間:(0 分鐘 1.084 秒)