注意
前往結尾以下載完整範例程式碼。
具有直方圖的散佈圖#
在繪圖的側面顯示散佈圖的邊際分佈,作為直方圖。
為了使主軸與邊際對齊,以下顯示了兩個選項
雖然 Axes.inset_axes 可能有點複雜,但它允許正確處理具有固定長寬比的主軸。
在 使用可定位軸對齊直方圖至散佈圖範例中,顯示了使用 axes_grid1 工具組產生類似圖形的替代方法。最後,也可以使用 Figure.add_axes 以絕對座標定位所有軸(此處未顯示)。
讓我們先定義一個函式,該函式將 x 和 y 資料作為輸入,以及三個軸,用於散佈圖的主軸和兩個邊際軸。然後,它將在提供的軸內建立散佈圖和直方圖。
import matplotlib.pyplot as plt
import numpy as np

# Fixing random state for reproducibility
np.random.seed(19680801)

# some random data
x = np.random.randn(1000)
y = np.random.randn(1000)


def scatter_hist(x, y, ax, ax_histx, ax_histy):
    # no labels
    ax_histx.tick_params(axis="x", labelbottom=False)
    ax_histy.tick_params(axis="y", labelleft=False)

    # the scatter plot:
    ax.scatter(x, y)

    # now determine nice limits by hand:
    binwidth = 0.25
    xymax = max(np.max(np.abs(x)), np.max(np.abs(y)))
    lim = (int(xymax/binwidth) + 1) * binwidth

    bins = np.arange(-lim, lim + binwidth, binwidth)
    ax_histx.hist(x, bins=bins)
    ax_histy.hist(y, bins=bins, orientation='horizontal')
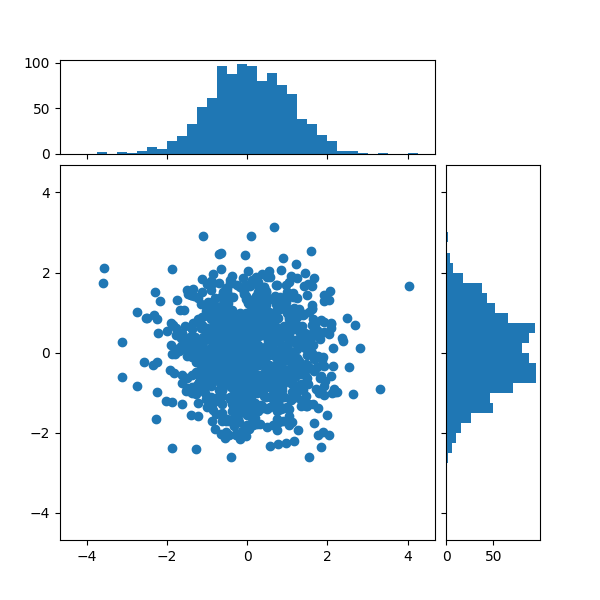
使用 gridspec 定義軸位置#
我們定義一個具有不相等寬度和高度比的 gridspec,以實現所需的版面配置。另請參閱 在圖表中排列多個軸教學課程。
# Start with a square Figure.
fig = plt.figure(figsize=(6, 6))
# Add a gridspec with two rows and two columns and a ratio of 1 to 4 between
# the size of the marginal Axes and the main Axes in both directions.
# Also adjust the subplot parameters for a square plot.
gs = fig.add_gridspec(2, 2,  width_ratios=(4, 1), height_ratios=(1, 4),
                      left=0.1, right=0.9, bottom=0.1, top=0.9,
                      wspace=0.05, hspace=0.05)
# Create the Axes.
ax = fig.add_subplot(gs[1, 0])
ax_histx = fig.add_subplot(gs[0, 0], sharex=ax)
ax_histy = fig.add_subplot(gs[1, 1], sharey=ax)
# Draw the scatter plot and marginals.
scatter_hist(x, y, ax, ax_histx, ax_histy)
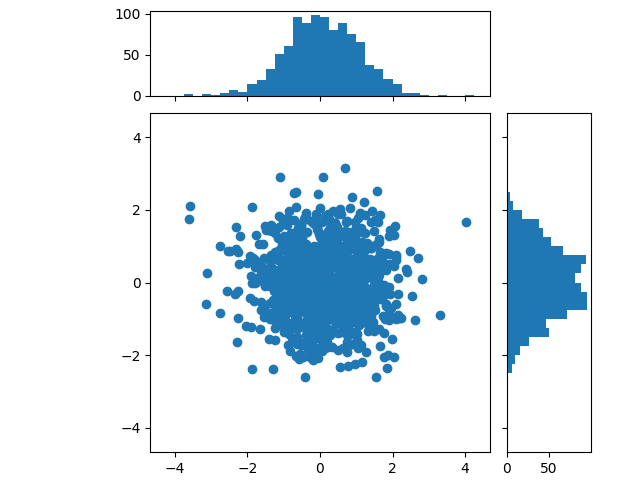
使用 inset_axes 定義軸位置#
inset_axes 可用於在主軸外部定位邊際。這樣做的好處是,可以固定主軸的長寬比,並且邊際將始終相對於軸的位置繪製。
# Create a Figure, which doesn't have to be square.
fig = plt.figure(layout='constrained')
# Create the main Axes, leaving 25% of the figure space at the top and on the
# right to position marginals.
ax = fig.add_gridspec(top=0.75, right=0.75).subplots()
# The main Axes' aspect can be fixed.
ax.set(aspect=1)
# Create marginal Axes, which have 25% of the size of the main Axes.  Note that
# the inset Axes are positioned *outside* (on the right and the top) of the
# main Axes, by specifying axes coordinates greater than 1.  Axes coordinates
# less than 0 would likewise specify positions on the left and the bottom of
# the main Axes.
ax_histx = ax.inset_axes([0, 1.05, 1, 0.25], sharex=ax)
ax_histy = ax.inset_axes([1.05, 0, 0.25, 1], sharey=ax)
# Draw the scatter plot and marginals.
scatter_hist(x, y, ax, ax_histx, ax_histy)

plt.show()
參考文獻
此範例中顯示了下列函式、方法、類別和模組的使用
腳本總執行時間:(0 分鐘 2.585 秒)