註記
前往結尾以下載完整範例程式碼。
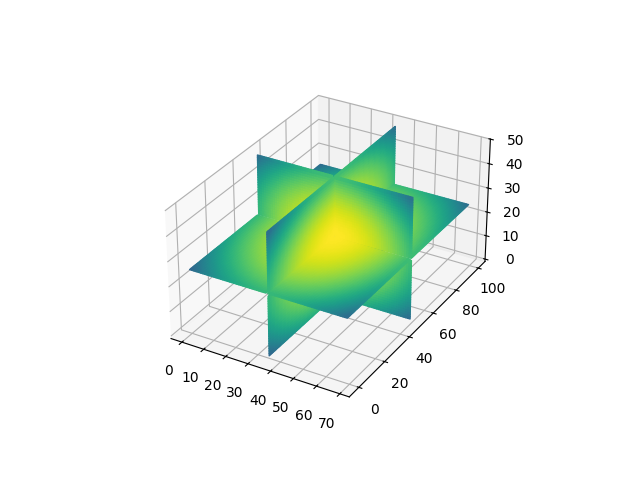
相交平面#
此範例示範如何在 3D 中繪製相交平面。它是3D 中的 2D 影像的推廣。
在mplot3d中繪製相交平面很複雜,因為mplot3d並非真正的 3D 渲染器,而只是將藝術家投射到 3D 中並按正確順序繪製它們。如果藝術家互相重疊,則此方法無法正確運作。在此範例中,我們藉由在平面相交處分割它們,將每個平面分成四個部分,來解決互相重疊的問題。
此範例僅適用於彼此對分切割的平面。此限制是為了讓程式碼更易於閱讀。當然,可以於任意位置切割,但會使程式碼更加複雜。因此,此範例更像是示範如何繞過 3D 可視化的限制的概念,而不是繪製任意相交平面的精細解決方案,您可以照原樣複製貼上。
import matplotlib.pyplot as plt
import numpy as np


def plot_quadrants(ax, array, fixed_coord, cmap):
    """For a given 3d *array* plot a plane with *fixed_coord*, using four quadrants."""
    nx, ny, nz = array.shape
    index = {
        'x': (nx // 2, slice(None), slice(None)),
        'y': (slice(None), ny // 2, slice(None)),
        'z': (slice(None), slice(None), nz // 2),
    }[fixed_coord]
    plane_data = array[index]

    n0, n1 = plane_data.shape
    quadrants = [
        plane_data[:n0 // 2, :n1 // 2],
        plane_data[:n0 // 2, n1 // 2:],
        plane_data[n0 // 2:, :n1 // 2],
        plane_data[n0 // 2:, n1 // 2:]
    ]

    min_val = array.min()
    max_val = array.max()

    cmap = plt.get_cmap(cmap)

    for i, quadrant in enumerate(quadrants):
        facecolors = cmap((quadrant - min_val) / (max_val - min_val))
        if fixed_coord == 'x':
            Y, Z = np.mgrid[0:ny // 2, 0:nz // 2]
            X = nx // 2 * np.ones_like(Y)
            Y_offset = (i // 2) * ny // 2
            Z_offset = (i % 2) * nz // 2
            ax.plot_surface(X, Y + Y_offset, Z + Z_offset, rstride=1, cstride=1,
                            facecolors=facecolors, shade=False)
        elif fixed_coord == 'y':
            X, Z = np.mgrid[0:nx // 2, 0:nz // 2]
            Y = ny // 2 * np.ones_like(X)
            X_offset = (i // 2) * nx // 2
            Z_offset = (i % 2) * nz // 2
            ax.plot_surface(X + X_offset, Y, Z + Z_offset, rstride=1, cstride=1,
                            facecolors=facecolors, shade=False)
        elif fixed_coord == 'z':
            X, Y = np.mgrid[0:nx // 2, 0:ny // 2]
            Z = nz // 2 * np.ones_like(X)
            X_offset = (i // 2) * nx // 2
            Y_offset = (i % 2) * ny // 2
            ax.plot_surface(X + X_offset, Y + Y_offset, Z, rstride=1, cstride=1,
                            facecolors=facecolors, shade=False)


def figure_3D_array_slices(array, cmap=None):
    """Plot a 3d array using three intersecting centered planes."""
    fig = plt.figure()
    ax = fig.add_subplot(projection='3d')
    ax.set_box_aspect(array.shape)
    plot_quadrants(ax, array, 'x', cmap=cmap)
    plot_quadrants(ax, array, 'y', cmap=cmap)
    plot_quadrants(ax, array, 'z', cmap=cmap)
    return fig, ax


nx, ny, nz = 70, 100, 50
r_square = (np.mgrid[-1:1:1j * nx, -1:1:1j * ny, -1:1:1j * nz] ** 2).sum(0)

figure_3D_array_slices(r_square, cmap='viridis_r')
plt.show()
腳本的總執行時間: (0 分鐘 5.833 秒)