注意
前往結尾以下載完整的範例程式碼。
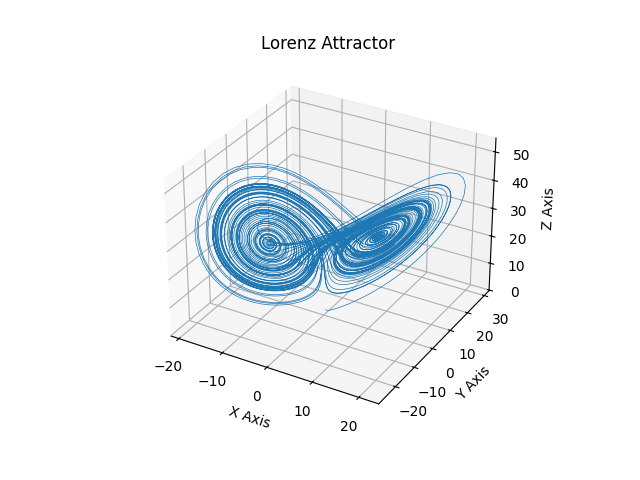
洛倫茨吸引子#
這是使用 mplot3d 在 3 維空間中繪製 Edward Lorenz 1963 年的「確定性非週期流」範例。
注意
因為這是一個簡單的非線性 ODE,使用 SciPy 的 ODE 解算器會更容易完成,但此方法僅取決於 NumPy。
import matplotlib.pyplot as plt
import numpy as np


def lorenz(xyz, *, s=10, r=28, b=2.667):
    """
    Parameters
    ----------
    xyz : array-like, shape (3,)
       Point of interest in three-dimensional space.
    s, r, b : float
       Parameters defining the Lorenz attractor.

    Returns
    -------
    xyz_dot : array, shape (3,)
       Values of the Lorenz attractor's partial derivatives at *xyz*.
    """
    x, y, z = xyz
    x_dot = s*(y - x)
    y_dot = r*x - y - x*z
    z_dot = x*y - b*z
    return np.array([x_dot, y_dot, z_dot])


dt = 0.01
num_steps = 10000

xyzs = np.empty((num_steps + 1, 3))  # Need one more for the initial values
xyzs[0] = (0., 1., 1.05)  # Set initial values
# Step through "time", calculating the partial derivatives at the current point
# and using them to estimate the next point
for i in range(num_steps):
    xyzs[i + 1] = xyzs[i] + lorenz(xyzs[i]) * dt

# Plot
ax = plt.figure().add_subplot(projection='3d')

ax.plot(*xyzs.T, lw=0.5)
ax.set_xlabel("X Axis")
ax.set_ylabel("Y Axis")
ax.set_zlabel("Z Axis")
ax.set_title("Lorenz Attractor")

plt.show()
腳本的總執行時間: (0 分鐘 1.219 秒)