注意
前往結尾下載完整的範例程式碼。
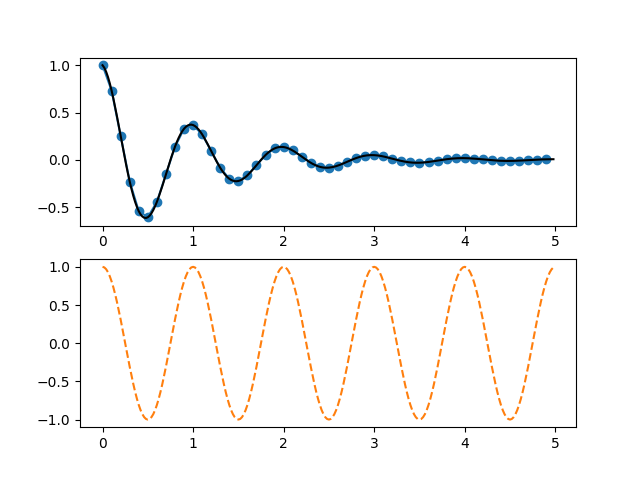
使用 pyplot 的兩個子圖#
使用 pyplot.subplot 建立具有兩個子圖的圖形。
import matplotlib.pyplot as plt
import numpy as np


def f(t):
    return np.exp(-t) * np.cos(2*np.pi*t)


t1 = np.arange(0.0, 5.0, 0.1)
t2 = np.arange(0.0, 5.0, 0.02)

plt.figure()
plt.subplot(211)
plt.plot(t1, f(t1), color='tab:blue', marker='o')
plt.plot(t2, f(t2), color='black')

plt.subplot(212)
plt.plot(t2, np.cos(2*np.pi*t2), color='tab:orange', linestyle='--')
plt.show()