注意
前往結尾以下載完整範例程式碼。
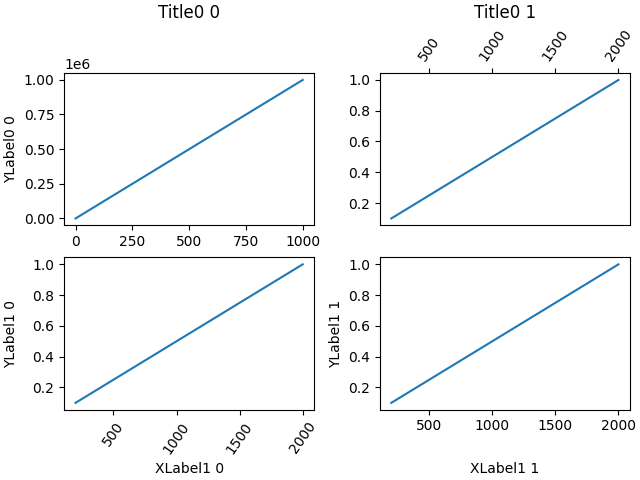
對齊標籤和標題#
使用Figure.align_xlabels、Figure.align_ylabels和Figure.align_titles對齊 xlabel、ylabel 和標題。
Figure.align_labels 包裝 x 和 y 標籤函式。
請注意,xlabel「XLabel1 1」通常會更靠近 x 軸,「YLabel0 0」會更靠近 y 軸,而標題「Title0 0」會更靠近各自軸的頂部。
import matplotlib.pyplot as plt
import numpy as np

fig, axs = plt.subplots(2, 2, layout='constrained')

ax = axs[0][0]
ax.plot(np.arange(0, 1e6, 1000))
ax.set_title('Title0 0')
ax.set_ylabel('YLabel0 0')

ax = axs[0][1]
ax.plot(np.arange(1., 0., -0.1) * 2000., np.arange(1., 0., -0.1))
ax.set_title('Title0 1')
ax.xaxis.tick_top()
ax.tick_params(axis='x', rotation=55)


for i in range(2):
    ax = axs[1][i]
    ax.plot(np.arange(1., 0., -0.1) * 2000., np.arange(1., 0., -0.1))
    ax.set_ylabel('YLabel1 %d' % i)
    ax.set_xlabel('XLabel1 %d' % i)
    if i == 0:
        ax.tick_params(axis='x', rotation=55)

fig.align_labels()  # same as fig.align_xlabels(); fig.align_ylabels()
fig.align_titles()

plt.show()
腳本的總執行時間: (0 分鐘 2.547 秒)