注意
前往結尾以下載完整的範例程式碼。
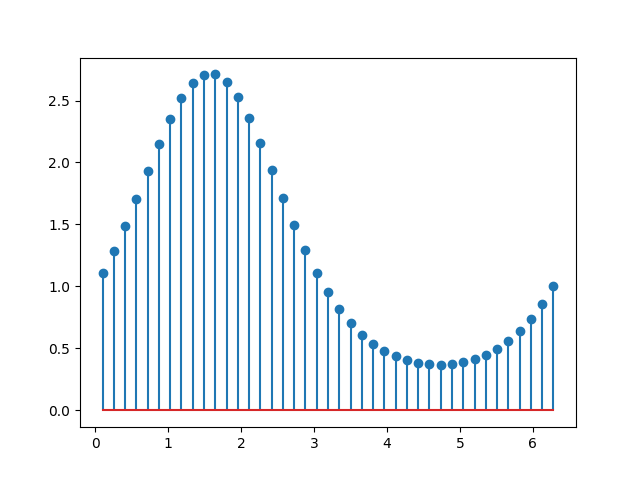
莖圖#
stem 從基線到 y 座標繪製垂直線,並在尖端放置標記。
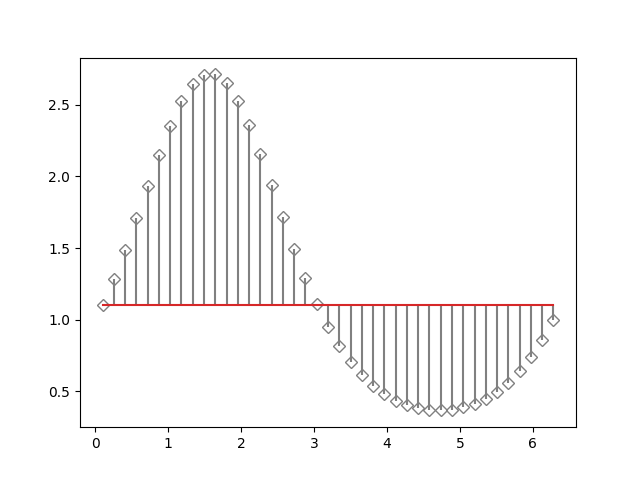
可以使用 *bottom* 調整基線的位置。參數 *linefmt*、*markerfmt* 和 *basefmt* 控制繪圖的基本格式屬性。但是,與 plot 相反,並非所有屬性都可以通過關鍵字參數設定。如需更進階的控制,請調整 pyplot 返回的線條物件。
markerline, stemlines, baseline = plt.stem(
    x, y, linefmt='grey', markerfmt='D', bottom=1.1)
markerline.set_markerfacecolor('none')
plt.show()