注意
前往結尾下載完整的範例程式碼。
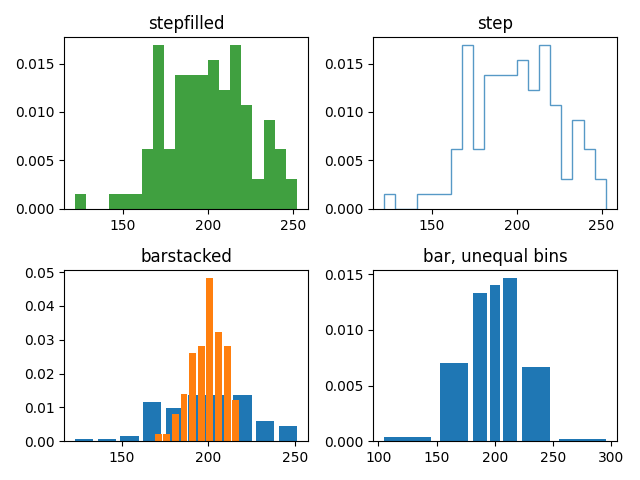
直方圖函數不同 histtype 設定的示範#
具有顏色填充的階梯曲線的直方圖。
沒有填充的階梯曲線的直方圖。
具有自訂且不均等箱寬的直方圖。
具有堆疊長條的兩個直方圖。
選取不同的箱計數和大小會顯著影響直方圖的形狀。Astropy 文件中有一個關於如何選取這些參數的出色章節:http://docs.astropy.org/en/stable/visualization/histogram.html
import matplotlib.pyplot as plt
import numpy as np

np.random.seed(19680801)

mu_x = 200
sigma_x = 25
x = np.random.normal(mu_x, sigma_x, size=100)

mu_w = 200
sigma_w = 10
w = np.random.normal(mu_w, sigma_w, size=100)

fig, axs = plt.subplots(nrows=2, ncols=2)

axs[0, 0].hist(x, 20, density=True, histtype='stepfilled', facecolor='g',
               alpha=0.75)
axs[0, 0].set_title('stepfilled')

axs[0, 1].hist(x, 20, density=True, histtype='step', facecolor='g',
               alpha=0.75)
axs[0, 1].set_title('step')

axs[1, 0].hist(x, density=True, histtype='barstacked', rwidth=0.8)
axs[1, 0].hist(w, density=True, histtype='barstacked', rwidth=0.8)
axs[1, 0].set_title('barstacked')

# Create a histogram by providing the bin edges (unequally spaced).
bins = [100, 150, 180, 195, 205, 220, 250, 300]
axs[1, 1].hist(x, bins, density=True, histtype='bar', rwidth=0.8)
axs[1, 1].set_title('bar, unequal bins')

fig.tight_layout()
plt.show()
腳本的總執行時間: (0 分鐘 1.583 秒)