注意
前往結尾以下載完整的範例程式碼。
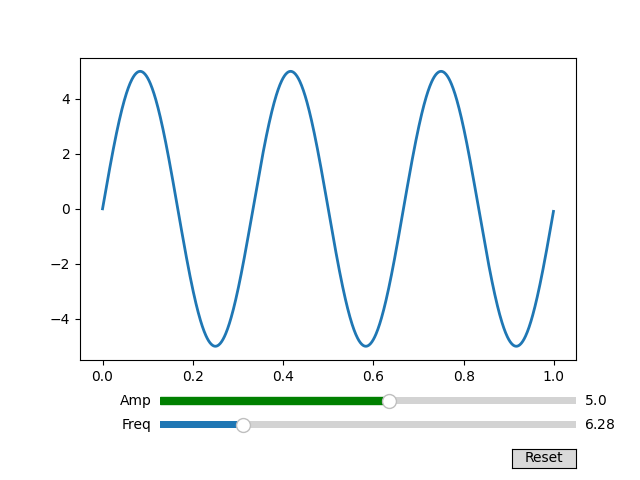
將滑桿捕捉到離散值#
您可以使用 valstep 引數將滑桿值捕捉到離散值。
在此範例中,Freq 滑桿被限制為 pi 的倍數,而 Amp 滑桿使用陣列作為 valstep 引數,以更密集地取樣其範圍的第一部分。
請參閱 滑桿,以取得使用 Slider 控制單一浮點數的範例。
請參閱 使用 RangeSlider 縮放影像,以取得使用 RangeSlider 定義值範圍的範例。
import matplotlib.pyplot as plt
import numpy as np

from matplotlib.widgets import Button, Slider

t = np.arange(0.0, 1.0, 0.001)
a0 = 5
f0 = 3
s = a0 * np.sin(2 * np.pi * f0 * t)

fig, ax = plt.subplots()
fig.subplots_adjust(bottom=0.25)
l, = ax.plot(t, s, lw=2)

ax_freq = fig.add_axes([0.25, 0.1, 0.65, 0.03])
ax_amp = fig.add_axes([0.25, 0.15, 0.65, 0.03])

# define the values to use for snapping
allowed_amplitudes = np.concatenate([np.linspace(.1, 5, 100), [6, 7, 8, 9]])

# create the sliders
samp = Slider(
    ax_amp, "Amp", 0.1, 9.0,
    valinit=a0, valstep=allowed_amplitudes,
    color="green"
)

sfreq = Slider(
    ax_freq, "Freq", 0, 10*np.pi,
    valinit=2*np.pi, valstep=np.pi,
    initcolor='none'  # Remove the line marking the valinit position.
)


def update(val):
    amp = samp.val
    freq = sfreq.val
    l.set_ydata(amp*np.sin(2*np.pi*freq*t))
    fig.canvas.draw_idle()


sfreq.on_changed(update)
samp.on_changed(update)

ax_reset = fig.add_axes([0.8, 0.025, 0.1, 0.04])
button = Button(ax_reset, 'Reset', hovercolor='0.975')


def reset(event):
    sfreq.reset()
    samp.reset()
button.on_clicked(reset)


plt.show()