注意
前往結尾以下載完整的範例程式碼。
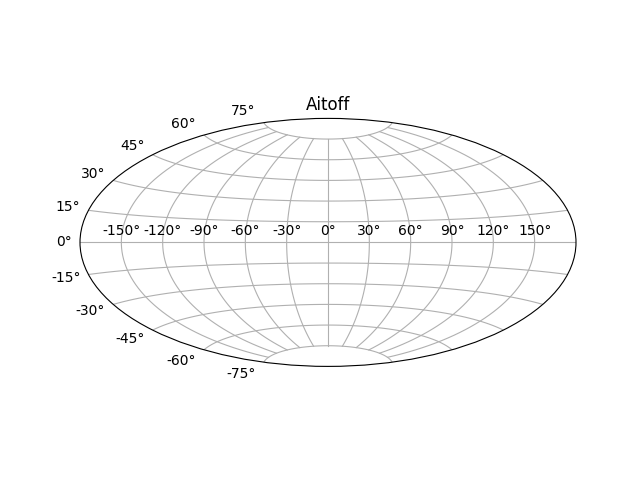
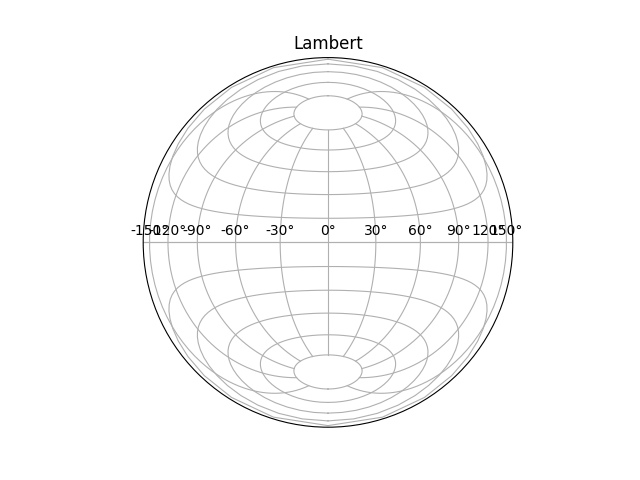
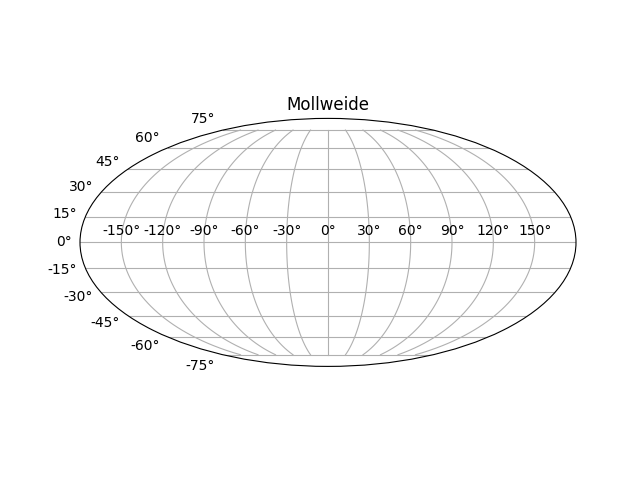
地理投影#
這顯示了 4 種可能的地理投影。 Cartopy 支援更多投影。
import matplotlib.pyplot as plt
plt.figure()
plt.subplot(projection="aitoff")
plt.title("Aitoff")
plt.grid(True)
plt.figure()
plt.subplot(projection="hammer")
plt.title("Hammer")
plt.grid(True)

plt.figure()
plt.subplot(projection="lambert")
plt.title("Lambert")
plt.grid(True)
plt.figure()
plt.subplot(projection="mollweide")
plt.title("Mollweide")
plt.grid(True)

plt.show()
腳本總執行時間: (0 分鐘 2.969 秒)