注意
跳到結尾以下載完整的範例程式碼。
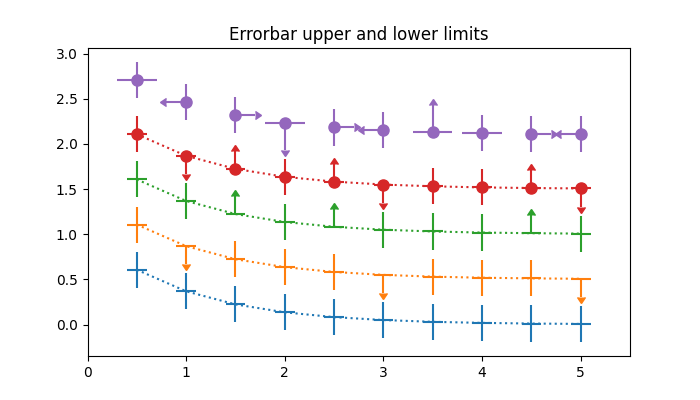
在誤差線中包含上限和下限#
在 matplotlib 中,誤差線可以有「限制」。將限制套用到誤差線本質上會使誤差變成單向的。因此,可以分別透過 uplims、lolims、xuplims 和 xlolims 參數,在 y 和 x 方向上套用上限和下限。這些參數可以是純量或布林陣列。
例如,如果 xlolims 為 True,則 x 誤差線只會從資料延伸到遞增值。如果 uplims 是一個填滿 False 的陣列,但第 4 和第 7 個值除外,則所有 y 誤差線都將是雙向的,除了第 4 和第 7 條,它們會從資料延伸到遞減的 y 值。
import matplotlib.pyplot as plt
import numpy as np

# example data
x = np.array([0.5, 1.0, 1.5, 2.0, 2.5, 3.0, 3.5, 4.0, 4.5, 5.0])
y = np.exp(-x)
xerr = 0.1
yerr = 0.2

# lower & upper limits of the error
lolims = np.array([0, 0, 1, 0, 1, 0, 0, 0, 1, 0], dtype=bool)
uplims = np.array([0, 1, 0, 0, 0, 1, 0, 0, 0, 1], dtype=bool)
ls = 'dotted'

fig, ax = plt.subplots(figsize=(7, 4))

# standard error bars
ax.errorbar(x, y, xerr=xerr, yerr=yerr, linestyle=ls)

# including upper limits
ax.errorbar(x, y + 0.5, xerr=xerr, yerr=yerr, uplims=uplims,
            linestyle=ls)

# including lower limits
ax.errorbar(x, y + 1.0, xerr=xerr, yerr=yerr, lolims=lolims,
            linestyle=ls)

# including upper and lower limits
ax.errorbar(x, y + 1.5, xerr=xerr, yerr=yerr,
            lolims=lolims, uplims=uplims,
            marker='o', markersize=8,
            linestyle=ls)

# Plot a series with lower and upper limits in both x & y
# constant x-error with varying y-error
xerr = 0.2
yerr = np.full_like(x, 0.2)
yerr[[3, 6]] = 0.3

# mock up some limits by modifying previous data
xlolims = lolims
xuplims = uplims
lolims = np.zeros_like(x)
uplims = np.zeros_like(x)
lolims[[6]] = True  # only limited at this index
uplims[[3]] = True  # only limited at this index

# do the plotting
ax.errorbar(x, y + 2.1, xerr=xerr, yerr=yerr,
            xlolims=xlolims, xuplims=xuplims,
            uplims=uplims, lolims=lolims,
            marker='o', markersize=8,
            linestyle='none')

# tidy up the figure
ax.set_xlim((0, 5.5))
ax.set_title('Errorbar upper and lower limits')
plt.show()