注意
跳到結尾以下載完整的範例程式碼。
軸框長寬比#
此示範顯示如何透過 set_box_aspect 直接設定軸框的長寬比。框長寬比是軸高度和軸寬度之間的比例,以實際單位表示,與資料限制無關。這對於產生正方形圖非常有用,而與其包含的資料無關,或者在具有固定(資料)長寬比的影像圖旁邊放置一個具有相同軸尺寸的普通圖。
以下列出了 set_box_aspect 的一些用例。
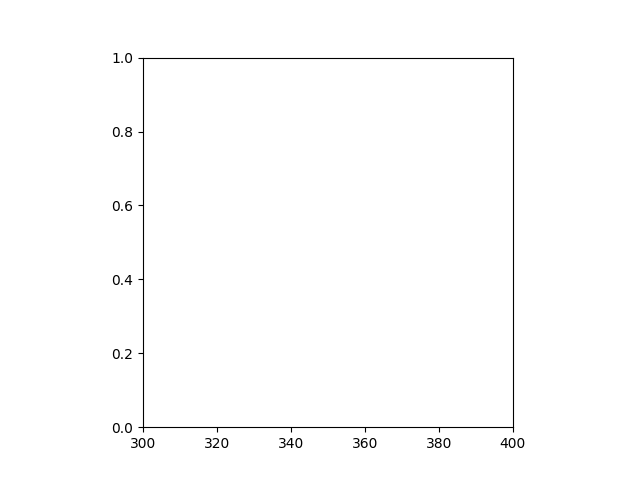
與資料無關的正方形軸#
產生一個正方形軸,無論資料限制為何。
import matplotlib.pyplot as plt
import numpy as np

fig1, ax = plt.subplots()

ax.set_xlim(300, 400)
ax.set_box_aspect(1)

plt.show()
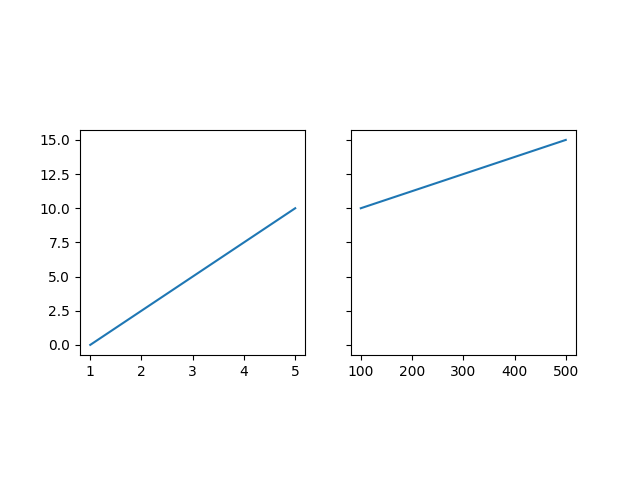
共用的正方形軸#
產生尺寸為正方形的共用子圖。
fig2, (ax, ax2) = plt.subplots(ncols=2, sharey=True)

ax.plot([1, 5], [0, 10])
ax2.plot([100, 500], [10, 15])

ax.set_box_aspect(1)
ax2.set_box_aspect(1)

plt.show()
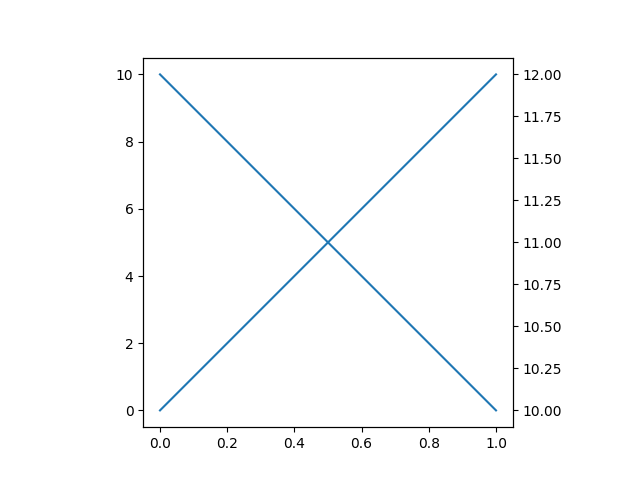
正方形雙軸#
產生一個正方形軸,帶有一個雙軸。雙軸接管父軸的框長寬比。
fig3, ax = plt.subplots()

ax2 = ax.twinx()

ax.plot([0, 10])
ax2.plot([12, 10])

ax.set_box_aspect(1)

plt.show()
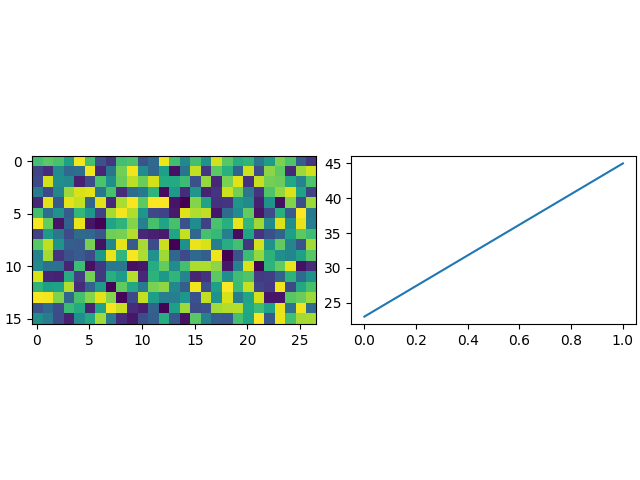
影像旁的普通圖#
在建立具有固定資料長寬比和預設 adjustable="box" 的影像圖時,在普通圖旁邊,軸的高度會不相等。 set_box_aspect 提供了一個簡單的解決方案,允許普通圖的軸使用影像尺寸作為框長寬比。
此範例也顯示了約束佈局如何與固定的框長寬比巧妙地相互作用。
fig4, (ax, ax2) = plt.subplots(ncols=2, layout="constrained")

np.random.seed(19680801)  # Fixing random state for reproducibility
im = np.random.rand(16, 27)
ax.imshow(im)

ax2.plot([23, 45])
ax2.set_box_aspect(im.shape[0]/im.shape[1])

plt.show()
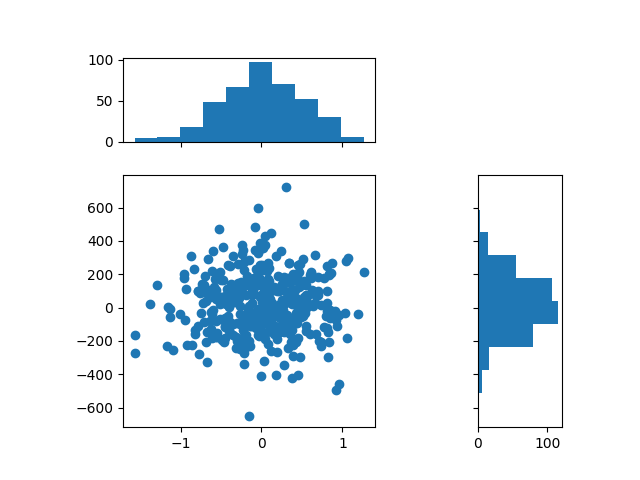
正方形聯合/邊緣圖#
可能需要在聯合資料圖旁邊顯示邊緣分佈。以下建立一個正方形圖,其中邊緣軸的框長寬比等於網格規格的寬度和高度比。這可確保所有軸完全對齊,而與圖表的大小無關。
fig5, axs = plt.subplots(2, 2, sharex="col", sharey="row",
                         gridspec_kw=dict(height_ratios=[1, 3],
                                          width_ratios=[3, 1]))
axs[0, 1].set_visible(False)
axs[0, 0].set_box_aspect(1/3)
axs[1, 0].set_box_aspect(1)
axs[1, 1].set_box_aspect(3/1)

np.random.seed(19680801)  # Fixing random state for reproducibility
x, y = np.random.randn(2, 400) * [[.5], [180]]
axs[1, 0].scatter(x, y)
axs[0, 0].hist(x)
axs[1, 1].hist(y, orientation="horizontal")

plt.show()
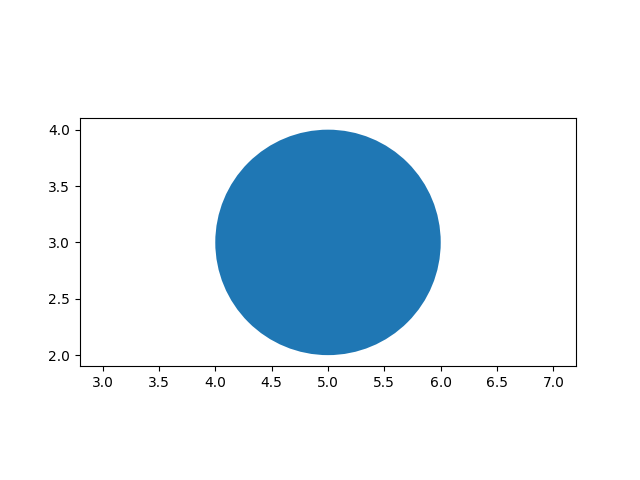
使用框長寬比設定資料長寬比#
在設定框長寬比時,仍然可以同時設定資料長寬比。在這裡,我們建立一個框長度是高度兩倍的軸,並為其內容使用「相等」的資料長寬比,即圓實際上保持圓形。
fig6, ax = plt.subplots()

ax.add_patch(plt.Circle((5, 3), 1))
ax.set_aspect("equal", adjustable="datalim")
ax.set_box_aspect(0.5)
ax.autoscale()

plt.show()
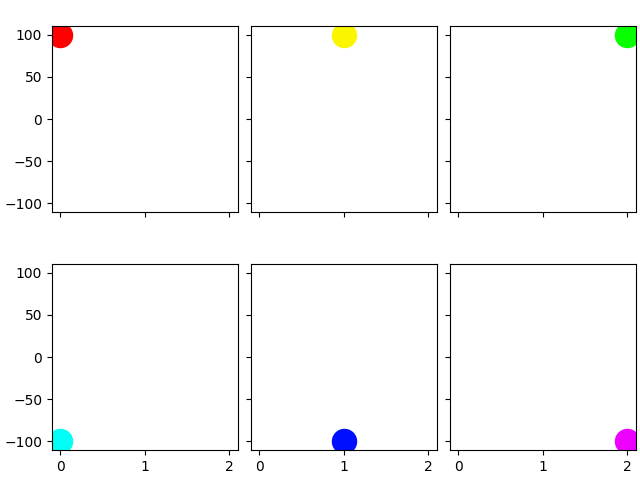
多個子圖的框長寬比#
可以在初始化時將框長寬比傳遞給軸。以下建立一個 2 x 3 子圖網格,其中所有軸都是正方形。
fig7, axs = plt.subplots(2, 3, subplot_kw=dict(box_aspect=1),
                         sharex=True, sharey=True, layout="constrained")

for i, ax in enumerate(axs.flat):
    ax.scatter(i % 3, -((i // 3) - 0.5)*200, c=[plt.cm.hsv(i / 6)], s=300)
plt.show()
腳本的總執行時間:(0 分鐘 5.237 秒)