注意
前往結尾下載完整範例程式碼。
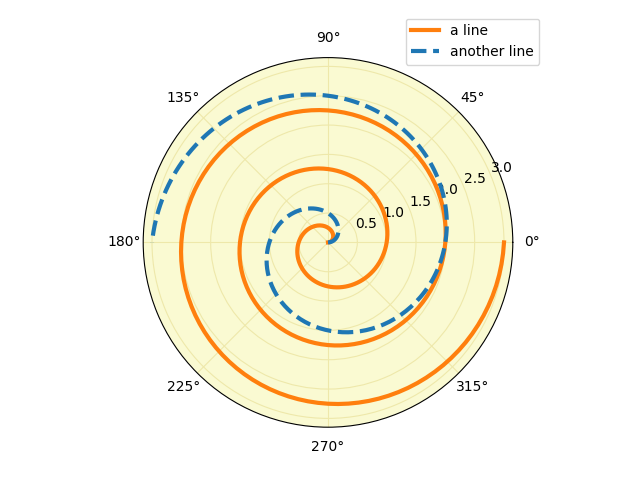
極座標圖例#
在極座標軸圖表上使用圖例。
import matplotlib.pyplot as plt
import numpy as np

fig = plt.figure()
ax = fig.add_subplot(projection="polar", facecolor="lightgoldenrodyellow")

r = np.linspace(0, 3, 301)
theta = 2 * np.pi * r
ax.plot(theta, r, color="tab:orange", lw=3, label="a line")
ax.plot(0.5 * theta, r, color="tab:blue", ls="--", lw=3, label="another line")
ax.tick_params(grid_color="palegoldenrod")
# For polar Axes, it may be useful to move the legend slightly away from the
# Axes center, to avoid overlap between the legend and the Axes.  The following
# snippet places the legend's lower left corner just outside the polar Axes
# at an angle of 67.5 degrees in polar coordinates.
angle = np.deg2rad(67.5)
ax.legend(loc="lower left",
          bbox_to_anchor=(.5 + np.cos(angle)/2, .5 + np.sin(angle)/2))

plt.show()
參考
本範例顯示以下函數、方法、類別和模組的使用