注意
前往結尾下載完整範例程式碼。
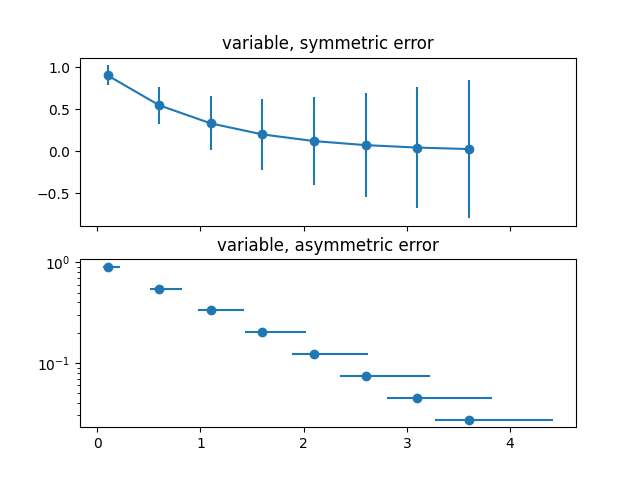
指定誤差條的不同方式#
誤差可以指定為常數值(如 誤差條函式 中所示)。但是,此範例示範如何透過指定誤差值的陣列來使誤差變化。
如果原始 x 和 y 資料的長度為 N,則有兩種選項
- 形狀為 (N,) 的陣列
誤差在每個點上都會變化,但誤差值是對稱的(即下限值和上限值相等)。
- 形狀為 (2, N) 的陣列
誤差在每個點上都會變化,並且下限和上限(依此順序)不同(非對稱情況)
此外,此範例示範如何將對數刻度與誤差條一起使用。
import matplotlib.pyplot as plt
import numpy as np

# example data
x = np.arange(0.1, 4, 0.5)
y = np.exp(-x)

# example error bar values that vary with x-position
error = 0.1 + 0.2 * x

fig, (ax0, ax1) = plt.subplots(nrows=2, sharex=True)
ax0.errorbar(x, y, yerr=error, fmt='-o')
ax0.set_title('variable, symmetric error')

# error bar values w/ different -/+ errors that
# also vary with the x-position
lower_error = 0.4 * error
upper_error = error
asymmetric_error = [lower_error, upper_error]

ax1.errorbar(x, y, xerr=asymmetric_error, fmt='o')
ax1.set_title('variable, asymmetric error')
ax1.set_yscale('log')
plt.show()
指令碼總執行時間: (0 分鐘 1.067 秒)