注意
前往結尾以下載完整的範例程式碼。
Symlog 演示#
symlog(對稱對數)軸縮放的範例用法。
import matplotlib.pyplot as plt
import numpy as np

dt = 0.01
x = np.arange(-50.0, 50.0, dt)
y = np.arange(0, 100.0, dt)

fig, (ax0, ax1, ax2) = plt.subplots(nrows=3)

ax0.plot(x, y)
ax0.set_xscale('symlog')
ax0.set_ylabel('symlogx')
ax0.grid()
ax0.xaxis.grid(which='minor')  # minor grid on too

ax1.plot(y, x)
ax1.set_yscale('symlog')
ax1.set_ylabel('symlogy')

ax2.plot(x, np.sin(x / 3.0))
ax2.set_xscale('symlog')
ax2.set_yscale('symlog', linthresh=0.015)
ax2.grid()
ax2.set_ylabel('symlog both')

fig.tight_layout()
plt.show()
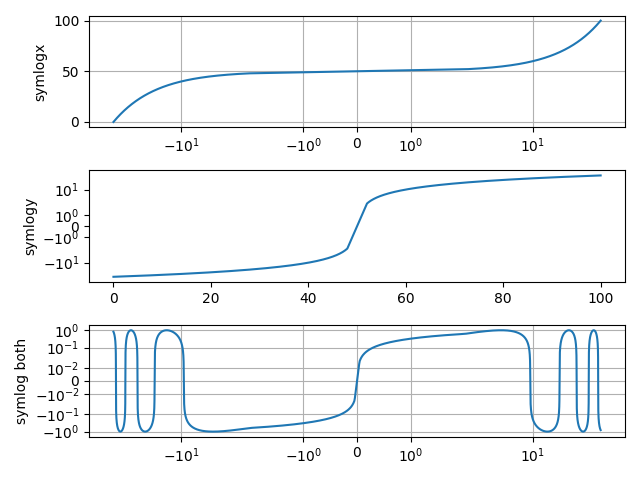
應該注意的是,symlog 使用的座標轉換在其線性和對數區域之間的轉換處具有不連續的梯度。asinh 軸刻度是一種替代技術,可以避免這些不連續性造成的視覺假影。
參考資料
腳本的總執行時間: (0 分鐘 1.024 秒)