注意
前往結尾下載完整範例程式碼。
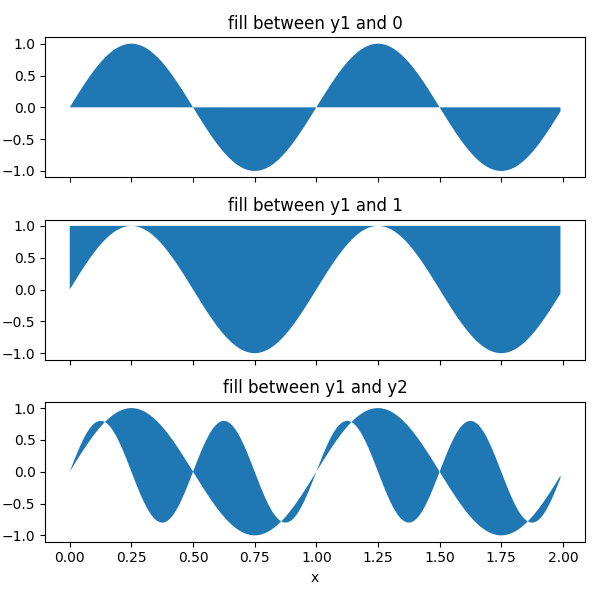
填滿兩條線之間的區域#
此範例示範如何使用 fill_between 來著色兩條線之間的區域。
import matplotlib.pyplot as plt
import numpy as np
基本用法#
參數 *y1* 和 *y2* 可以是純量,表示給定 y 值的水平邊界。如果只給定 *y1*,則 *y2* 預設為 0。
x = np.arange(0.0, 2, 0.01)
y1 = np.sin(2 * np.pi * x)
y2 = 0.8 * np.sin(4 * np.pi * x)

fig, (ax1, ax2, ax3) = plt.subplots(3, 1, sharex=True, figsize=(6, 6))

ax1.fill_between(x, y1)
ax1.set_title('fill between y1 and 0')

ax2.fill_between(x, y1, 1)
ax2.set_title('fill between y1 and 1')

ax3.fill_between(x, y1, y2)
ax3.set_title('fill between y1 and y2')
ax3.set_xlabel('x')
fig.tight_layout()
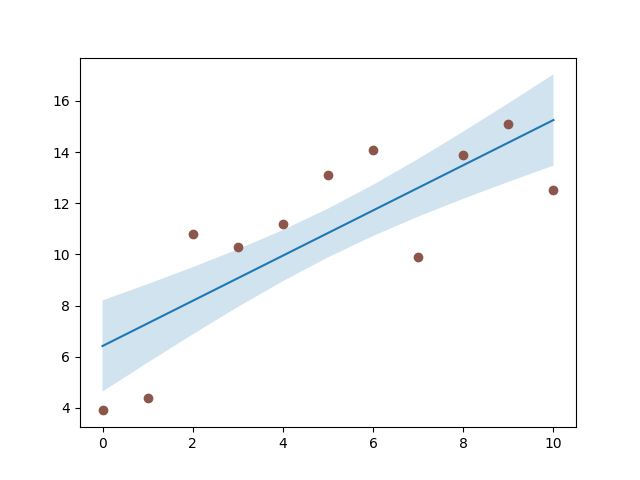
範例:信賴帶#
fill_between 的常見應用是表示信賴帶。
fill_between 使用顏色循環的顏色作為填滿顏色。這些顏色在應用於填滿區域時可能有點強烈。因此,通常好的做法是透過使用 *alpha* 使區域半透明來使顏色變淺。
N = 21
x = np.linspace(0, 10, 11)
y = [3.9, 4.4, 10.8, 10.3, 11.2, 13.1, 14.1,  9.9, 13.9, 15.1, 12.5]

# fit a linear curve and estimate its y-values and their error.
a, b = np.polyfit(x, y, deg=1)
y_est = a * x + b
y_err = x.std() * np.sqrt(1/len(x) +
                          (x - x.mean())**2 / np.sum((x - x.mean())**2))

fig, ax = plt.subplots()
ax.plot(x, y_est, '-')
ax.fill_between(x, y_est - y_err, y_est + y_err, alpha=0.2)
ax.plot(x, y, 'o', color='tab:brown')
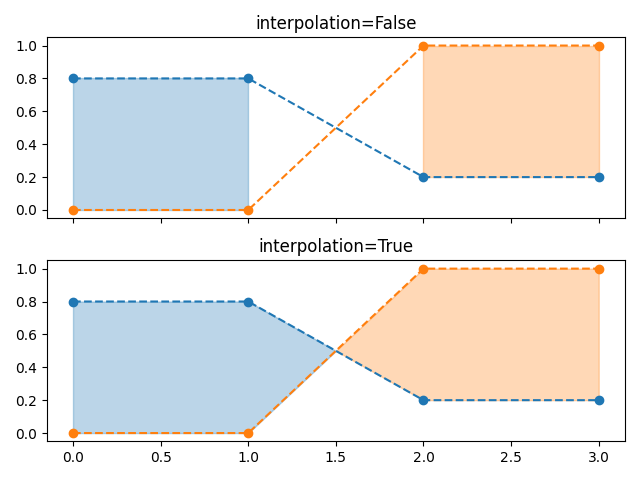
選擇性填滿水平區域#
參數 *where* 允許指定要填滿的 x 範圍。它是一個與 *x* 大小相同的布林陣列。
只會填滿連續 *True* 序列的 x 範圍。因此,永遠不會填滿相鄰 *True* 和 *False* 值之間的範圍。當資料點應表示連續數量時,這通常是不希望的。因此,建議設定 interpolate=True,除非資料點的 x 距離夠細,以至於不會注意到上述效果。內插法會近似 *where* 條件將會變更的實際 x 位置,並將填滿延伸至該位置。
x = np.array([0, 1, 2, 3])
y1 = np.array([0.8, 0.8, 0.2, 0.2])
y2 = np.array([0, 0, 1, 1])

fig, (ax1, ax2) = plt.subplots(2, 1, sharex=True)

ax1.set_title('interpolation=False')
ax1.plot(x, y1, 'o--')
ax1.plot(x, y2, 'o--')
ax1.fill_between(x, y1, y2, where=(y1 > y2), color='C0', alpha=0.3)
ax1.fill_between(x, y1, y2, where=(y1 < y2), color='C1', alpha=0.3)

ax2.set_title('interpolation=True')
ax2.plot(x, y1, 'o--')
ax2.plot(x, y2, 'o--')
ax2.fill_between(x, y1, y2, where=(y1 > y2), color='C0', alpha=0.3,
                 interpolate=True)
ax2.fill_between(x, y1, y2, where=(y1 <= y2), color='C1', alpha=0.3,
                 interpolate=True)
fig.tight_layout()
注意
如果 *y1* 或 *y2* 是遮罩陣列,則會發生類似的間隙。由於遺失的值無法近似,因此 *interpolate* 在這種情況下沒有效果。只能透過在遮罩值附近新增更多資料點來減少遮罩值周圍的間隙。
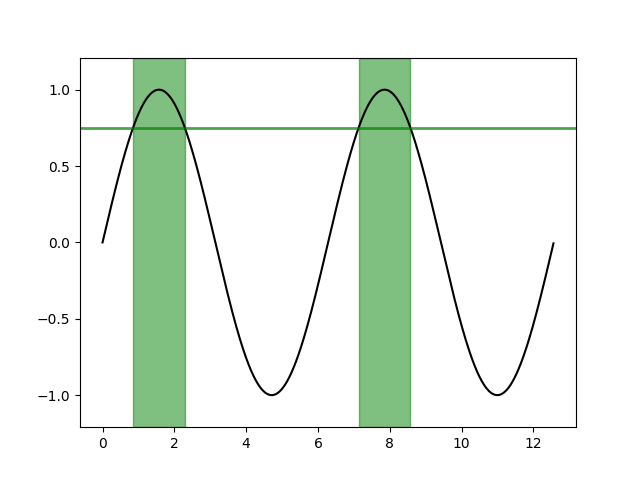
選擇性標記整個軸上的水平區域#
相同的選取機制可用於填滿軸的完整垂直高度。為了獨立於 y 限制,我們新增了一個轉換,該轉換會以資料座標解釋 x 值,並以軸座標解釋 y 值。
下列範例標記 y 資料高於給定閾值的區域。
fig, ax = plt.subplots()
x = np.arange(0, 4 * np.pi, 0.01)
y = np.sin(x)
ax.plot(x, y, color='black')

threshold = 0.75
ax.axhline(threshold, color='green', lw=2, alpha=0.7)
ax.fill_between(x, 0, 1, where=y > threshold,
                color='green', alpha=0.5, transform=ax.get_xaxis_transform())
參考文獻
此範例中顯示了下列函數、方法、類別和模組的使用方式
指令碼的總執行時間:(0 分鐘 4.548 秒)