注意
前往結尾下載完整的範例程式碼。
具名色彩清單#
此範例繪製 Matplotlib 支援的具名色彩清單。如需關於 matplotlib 中色彩的詳細資訊,請參閱
指定色彩教學課程;
matplotlib.colorsAPI;色彩演示。
用於繪圖的協助函式#
首先,我們定義一個協助函式來建立色彩表格,然後在一些常見的色彩類別中使用它。
import math

import matplotlib.pyplot as plt

import matplotlib.colors as mcolors
from matplotlib.patches import Rectangle


def plot_colortable(colors, *, ncols=4, sort_colors=True):

    cell_width = 212
    cell_height = 22
    swatch_width = 48
    margin = 12

    # Sort colors by hue, saturation, value and name.
    if sort_colors is True:
        names = sorted(
            colors, key=lambda c: tuple(mcolors.rgb_to_hsv(mcolors.to_rgb(c))))
    else:
        names = list(colors)

    n = len(names)
    nrows = math.ceil(n / ncols)

    width = cell_width * ncols + 2 * margin
    height = cell_height * nrows + 2 * margin
    dpi = 72

    fig, ax = plt.subplots(figsize=(width / dpi, height / dpi), dpi=dpi)
    fig.subplots_adjust(margin/width, margin/height,
                        (width-margin)/width, (height-margin)/height)
    ax.set_xlim(0, cell_width * ncols)
    ax.set_ylim(cell_height * (nrows-0.5), -cell_height/2.)
    ax.yaxis.set_visible(False)
    ax.xaxis.set_visible(False)
    ax.set_axis_off()

    for i, name in enumerate(names):
        row = i % nrows
        col = i // nrows
        y = row * cell_height

        swatch_start_x = cell_width * col
        text_pos_x = cell_width * col + swatch_width + 7

        ax.text(text_pos_x, y, name, fontsize=14,
                horizontalalignment='left',
                verticalalignment='center')

        ax.add_patch(
            Rectangle(xy=(swatch_start_x, y-9), width=swatch_width,
                      height=18, facecolor=colors[name], edgecolor='0.7')
        )

    return fig
基本色彩#
plot_colortable(mcolors.BASE_COLORS, ncols=3, sort_colors=False)
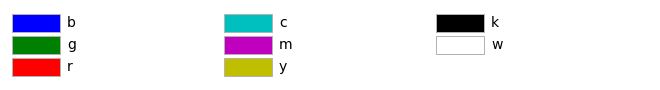
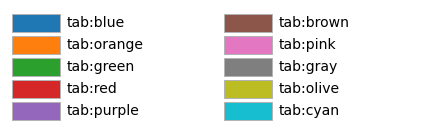
Tableau 調色盤#
plot_colortable(mcolors.TABLEAU_COLORS, ncols=2, sort_colors=False)
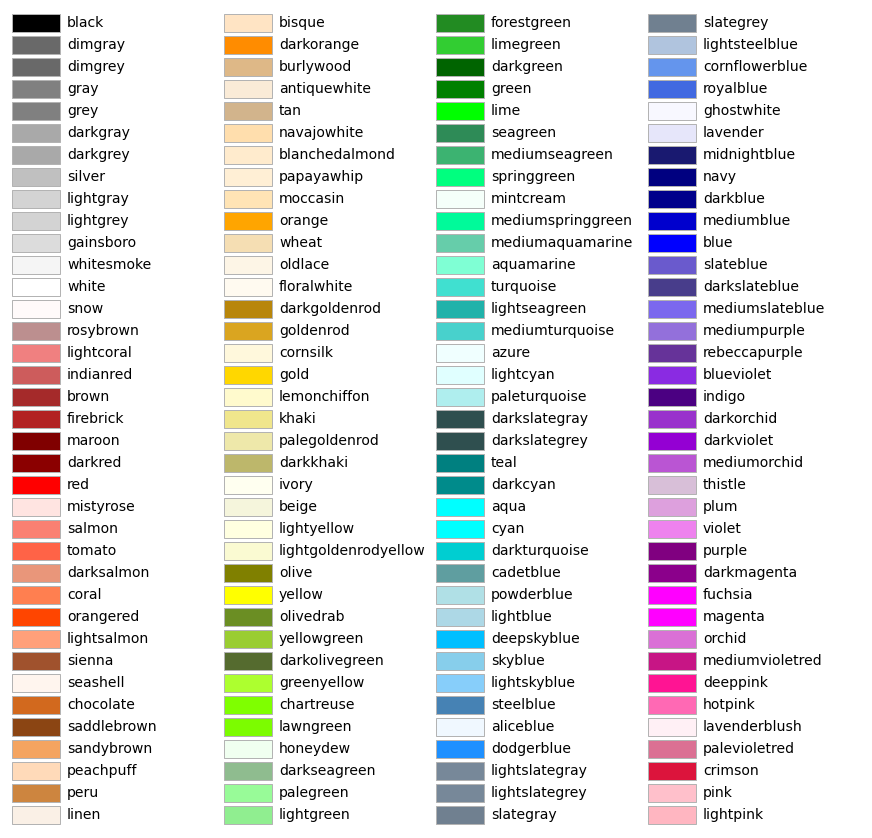
CSS 色彩#
plot_colortable(mcolors.CSS4_COLORS)
plt.show()
XKCD 色彩#
Matplotlib 支援來自 xkcd 色彩調查的色彩,例如 "xkcd:sky blue"。由於這包含將近 1000 種色彩,因此此圖形會非常大,因此省略在此。您可以使用下列程式碼自行產生概觀
xkcd_fig = plot_colortable(mcolors.XKCD_COLORS)
xkcd_fig.savefig("XKCD_Colors.png")
參考資料
此範例中顯示下列函式、方法、類別和模組的使用
指令碼的總執行時間:(0 分鐘 1.823 秒)