注意
跳至結尾以下載完整的範例程式碼。
主要和次要刻度#
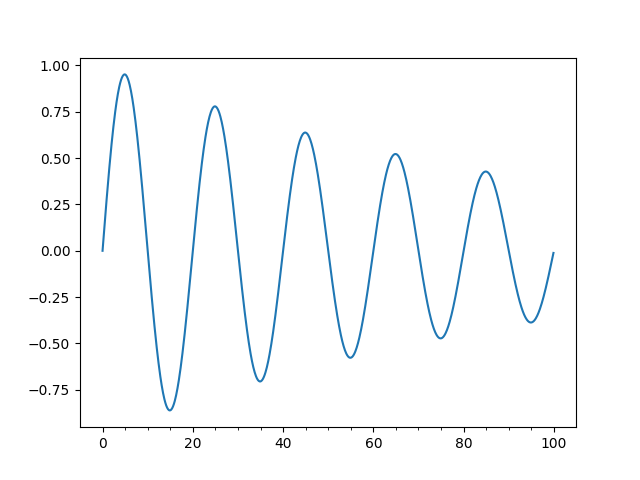
示範如何使用主要和次要刻度。
兩個相關的類別是 Locator 和 Formatter。Locator 決定刻度的位置,而 Formatter 控制刻度標籤的格式。
次要刻度預設為關閉(使用 NullLocator 和 NullFormatter)。可以透過設定次要定位器來開啟沒有標籤的次要刻度。可以透過設定次要格式器來開啟次要刻度標籤。
MultipleLocator 在某個基數的倍數上放置刻度。StrMethodFormatter 使用格式字串(例如 '{x:d}' 或 '{x:1.2f}' 或 '{x:1.1f} cm')來格式化刻度標籤(格式字串中的變數必須是 'x')。對於 StrMethodFormatter,字串可以直接傳遞給 Axis.set_major_formatter 或 Axis.set_minor_formatter。將自動建立並使用適當的 StrMethodFormatter。
pyplot.grid 會同時變更 x 軸和 y 軸主要刻度的網格設定。如果您想要控制給定軸的次要刻度網格,請使用例如
ax.xaxis.grid(True, which='minor')
請注意,給定的定位器或格式器執行個體只能用於單一軸(因為定位器會儲存軸資料和視圖限制的參考)。
import matplotlib.pyplot as plt
import numpy as np

from matplotlib.ticker import AutoMinorLocator, MultipleLocator

t = np.arange(0.0, 100.0, 0.1)
s = np.sin(0.1 * np.pi * t) * np.exp(-t * 0.01)

fig, ax = plt.subplots()
ax.plot(t, s)

# Make a plot with major ticks that are multiples of 20 and minor ticks that
# are multiples of 5.  Label major ticks with '.0f' formatting but don't label
# minor ticks.  The string is used directly, the `StrMethodFormatter` is
# created automatically.
ax.xaxis.set_major_locator(MultipleLocator(20))
ax.xaxis.set_major_formatter('{x:.0f}')

# For the minor ticks, use no labels; default NullFormatter.
ax.xaxis.set_minor_locator(MultipleLocator(5))

plt.show()

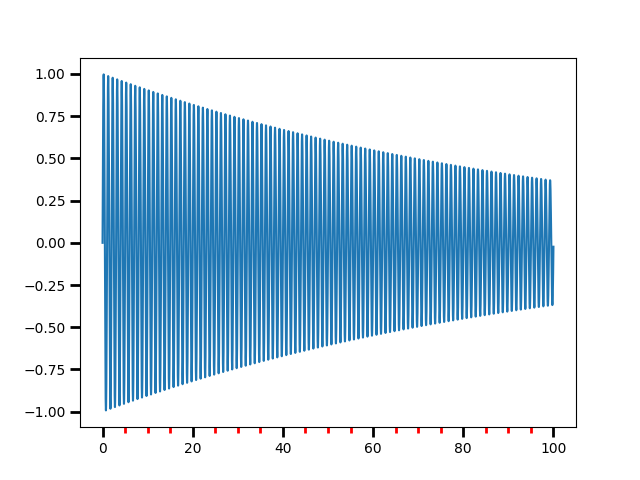
主要和次要刻度的自動刻度選擇。
使用互動式平移和縮放來查看刻度間隔如何變化。每個主要間隔將會有 4 或 5 個次要刻度間隔,具體取決於主要間隔。
可以提供一個引數給 AutoMinorLocator 以指定每個主要間隔的固定次要間隔數,例如 AutoMinorLocator(2) 會導致主要刻度之間有一個次要刻度。
t = np.arange(0.0, 100.0, 0.01)
s = np.sin(2 * np.pi * t) * np.exp(-t * 0.01)

fig, ax = plt.subplots()
ax.plot(t, s)

ax.xaxis.set_minor_locator(AutoMinorLocator())

ax.tick_params(which='both', width=2)
ax.tick_params(which='major', length=7)
ax.tick_params(which='minor', length=4, color='r')

plt.show()

參考資料
此範例中顯示了下列函數、方法、類別和模組的使用方式
腳本總執行時間:(0 分鐘 2.550 秒)