注意
前往結尾以下載完整的範例程式碼。
自動設定刻度位置#
設定刻度自動放置的行為。
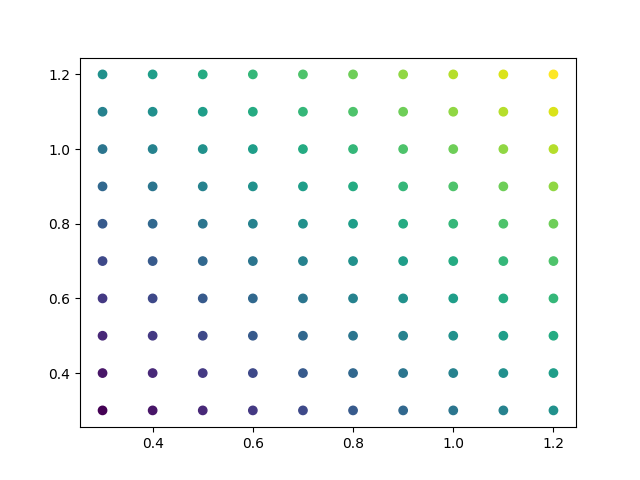
預設情況下,Matplotlib 會選擇刻度數量和刻度位置,以便軸上有合理的刻度數量,並且它們位於「整數」位置。
因此,圖表的邊緣可能沒有刻度。
import matplotlib.pyplot as plt
import numpy as np

np.random.seed(19680801)

fig, ax = plt.subplots()
dots = np.linspace(0.3, 1.2, 10)
X, Y = np.meshgrid(dots, dots)
x, y = X.ravel(), Y.ravel()
ax.scatter(x, y, c=x+y)
plt.show()
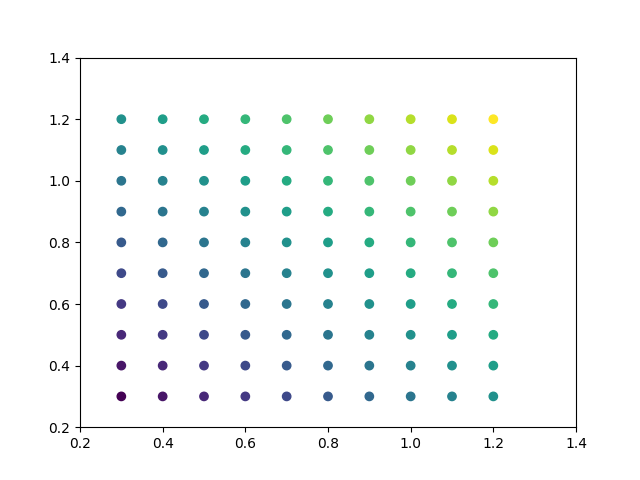
如果您想要將刻度保持在整數,並且在邊緣也有刻度,您可以將 rcParams["axes.autolimit_mode"] (預設值: 'data') 切換為 'round_numbers'。這會將軸限制擴展到下一個整數。
plt.rcParams['axes.autolimit_mode'] = 'round_numbers'

# Note: The limits are calculated at draw-time. Therefore, when using
# :rc:`axes.autolimit_mode` in a context manager, it is important that
# the ``show()`` command is within the context.

fig, ax = plt.subplots()
ax.scatter(x, y, c=x+y)
plt.show()
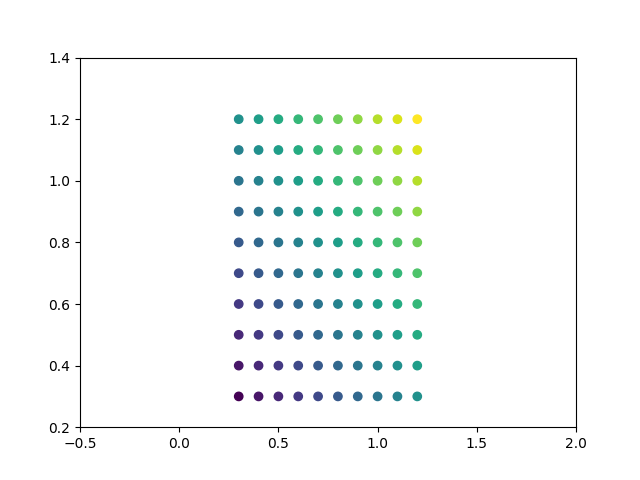
如果您使用 Axes.set_xmargin / Axes.set_ymargin 在資料周圍設定額外邊界時,仍然會遵循整數 autolimit_mode。
fig, ax = plt.subplots()
ax.scatter(x, y, c=x+y)
ax.set_xmargin(0.8)
plt.show()
腳本總執行時間:(0 分 2.327 秒)