注意
跳到最後以下載完整的範例程式碼。
合成自定義圖例#
逐步合成自定義圖例。
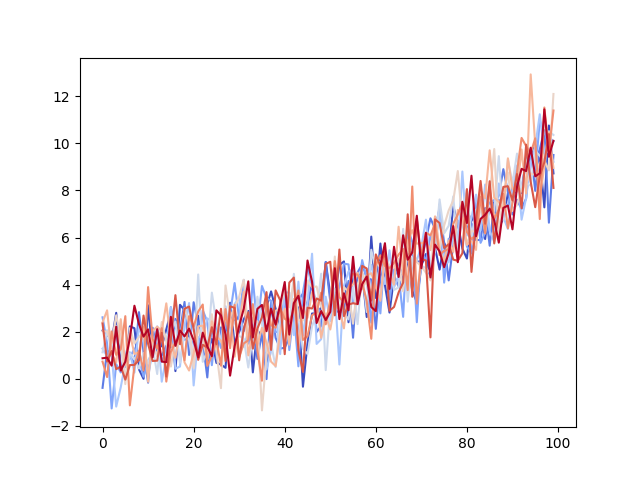
有時您不想要明確連結到您已繪製的資料的圖例。例如,假設您繪製了 10 條線,但不希望每個線都顯示圖例項目。如果您只是繪製線條並呼叫 ax.legend(),您將會得到以下結果
import matplotlib.pyplot as plt
import numpy as np

import matplotlib as mpl
from matplotlib import cycler

# Fixing random state for reproducibility
np.random.seed(19680801)
N = 10
data = (np.geomspace(1, 10, 100) + np.random.randn(N, 100)).T
cmap = plt.cm.coolwarm
mpl.rcParams['axes.prop_cycle'] = cycler(color=cmap(np.linspace(0, 1, N)))

fig, ax = plt.subplots()
lines = ax.plot(data)
由於資料沒有任何標籤,因此建立圖例需要我們定義圖示和標籤。在這種情況下,我們可以使用未明確連結到所繪製資料的 Matplotlib 物件來合成圖例。例如
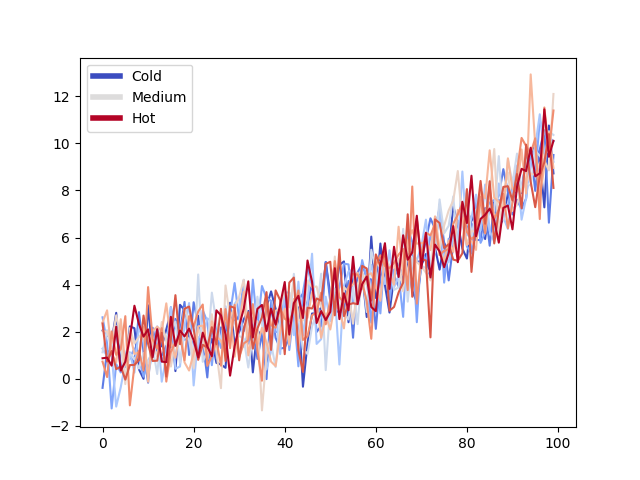
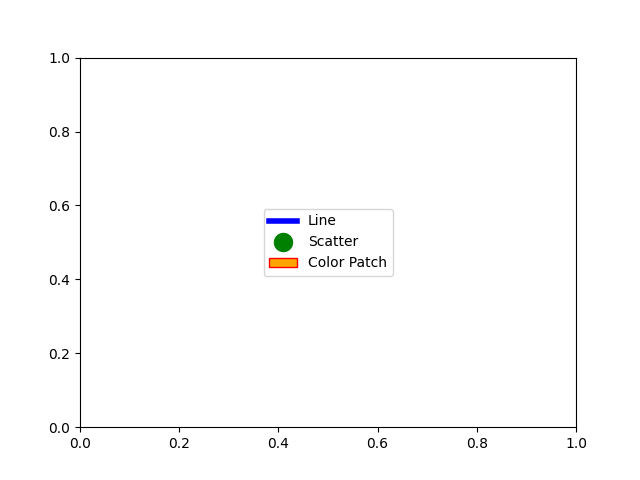
還有許多其他 Matplotlib 物件可以用這種方式使用。在下面的程式碼中,我們列出了一些常見的物件。
from matplotlib.lines import Line2D
from matplotlib.patches import Patch

legend_elements = [Line2D([0], [0], color='b', lw=4, label='Line'),
                   Line2D([0], [0], marker='o', color='w', label='Scatter',
                          markerfacecolor='g', markersize=15),
                   Patch(facecolor='orange', edgecolor='r',
                         label='Color Patch')]

# Create the figure
fig, ax = plt.subplots()
ax.legend(handles=legend_elements, loc='center')

plt.show()
腳本的總執行時間: (0 分鐘 3.363 秒)