註記
跳到結尾以下載完整範例程式碼。
標記符號參考#
Matplotlib 支援多種標記符號類別,這些類別使用繪圖命令的 marker 參數選取
如需所有標記符號的清單,另請參閱 matplotlib.markers 文件。
如需範例用法,請參閱 標記符號範例。
import matplotlib.pyplot as plt

from matplotlib.lines import Line2D
from matplotlib.markers import MarkerStyle
from matplotlib.transforms import Affine2D

text_style = dict(horizontalalignment='right', verticalalignment='center',
                  fontsize=12, fontfamily='monospace')
marker_style = dict(linestyle=':', color='0.8', markersize=10,
                    markerfacecolor="tab:blue", markeredgecolor="tab:blue")


def format_axes(ax):
    ax.margins(0.2)
    ax.set_axis_off()
    ax.invert_yaxis()


def split_list(a_list):
    i_half = len(a_list) // 2
    return a_list[:i_half], a_list[i_half:]
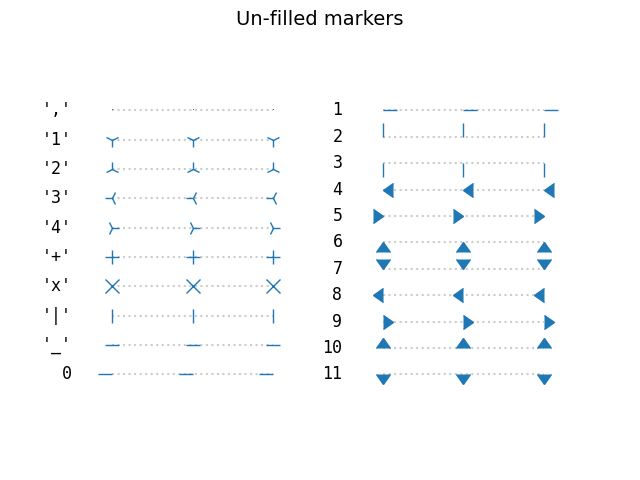
未填滿的標記符號#
未填滿的標記符號是單色的。
fig, axs = plt.subplots(ncols=2)
fig.suptitle('Un-filled markers', fontsize=14)

# Filter out filled markers and marker settings that do nothing.
unfilled_markers = [m for m, func in Line2D.markers.items()
                    if func != 'nothing' and m not in Line2D.filled_markers]

for ax, markers in zip(axs, split_list(unfilled_markers)):
    for y, marker in enumerate(markers):
        ax.text(-0.5, y, repr(marker), **text_style)
        ax.plot([y] * 3, marker=marker, **marker_style)
    format_axes(ax)
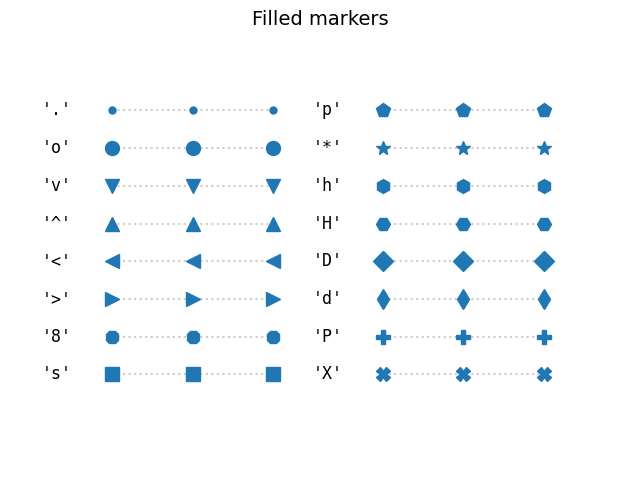
填滿的標記符號#
fig, axs = plt.subplots(ncols=2)
fig.suptitle('Filled markers', fontsize=14)
for ax, markers in zip(axs, split_list(Line2D.filled_markers)):
    for y, marker in enumerate(markers):
        ax.text(-0.5, y, repr(marker), **text_style)
        ax.plot([y] * 3, marker=marker, **marker_style)
    format_axes(ax)
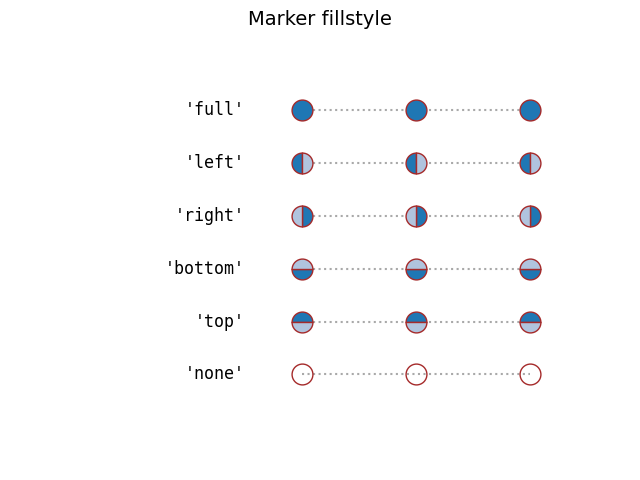
標記符號填滿樣式#
可分別指定填滿標記符號的邊緣顏色和填滿顏色。此外,可以將 fillstyle 設定為未填滿、完全填滿或各種方向的半填滿。半填滿樣式使用 markerfacecoloralt 作為次要填滿顏色。
fig, ax = plt.subplots()
fig.suptitle('Marker fillstyle', fontsize=14)
fig.subplots_adjust(left=0.4)

filled_marker_style = dict(marker='o', linestyle=':', markersize=15,
                           color='darkgrey',
                           markerfacecolor='tab:blue',
                           markerfacecoloralt='lightsteelblue',
                           markeredgecolor='brown')

for y, fill_style in enumerate(Line2D.fillStyles):
    ax.text(-0.5, y, repr(fill_style), **text_style)
    ax.plot([y] * 3, fillstyle=fill_style, **filled_marker_style)
format_axes(ax)
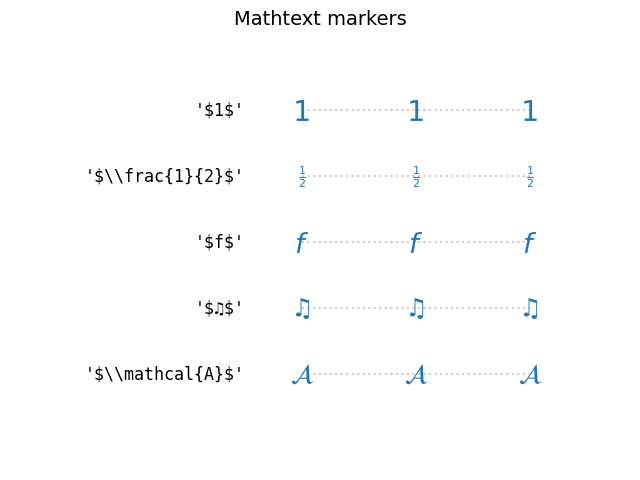
從 TeX 符號建立的標記符號#
使用 MathText 以使用自訂標記符號,例如 "$\u266B$"。如需 STIX 字型符號的概觀,請參閱 STIX 字型表。另請參閱 STIX 字型。
fig, ax = plt.subplots()
fig.suptitle('Mathtext markers', fontsize=14)
fig.subplots_adjust(left=0.4)

marker_style.update(markeredgecolor="none", markersize=15)
markers = ["$1$", r"$\frac{1}{2}$", "$f$", "$\u266B$", r"$\mathcal{A}$"]

for y, marker in enumerate(markers):
    # Escape dollars so that the text is written "as is", not as mathtext.
    ax.text(-0.5, y, repr(marker).replace("$", r"\$"), **text_style)
    ax.plot([y] * 3, marker=marker, **marker_style)
format_axes(ax)
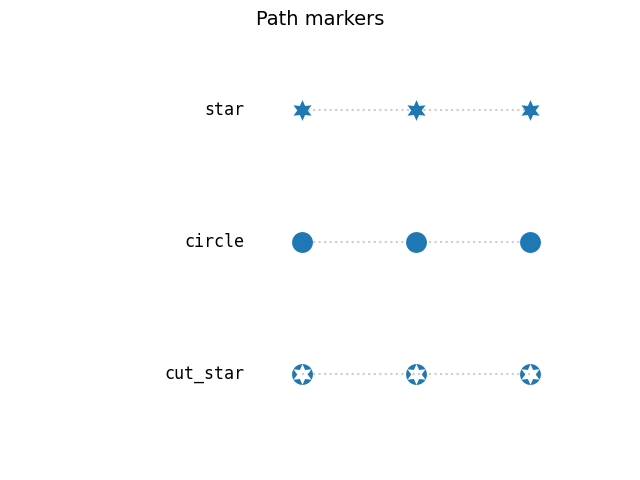
從路徑建立的標記符號#
任何 Path 都可用作標記符號。以下範例顯示兩個簡單路徑 *star* 和 *circle*,以及更精細的帶有切口星形的圓形路徑。
import numpy as np

import matplotlib.path as mpath

star = mpath.Path.unit_regular_star(6)
circle = mpath.Path.unit_circle()
# concatenate the circle with an internal cutout of the star
cut_star = mpath.Path(
    vertices=np.concatenate([circle.vertices, star.vertices[::-1, ...]]),
    codes=np.concatenate([circle.codes, star.codes]))

fig, ax = plt.subplots()
fig.suptitle('Path markers', fontsize=14)
fig.subplots_adjust(left=0.4)

markers = {'star': star, 'circle': circle, 'cut_star': cut_star}

for y, (name, marker) in enumerate(markers.items()):
    ax.text(-0.5, y, name, **text_style)
    ax.plot([y] * 3, marker=marker, **marker_style)
format_axes(ax)
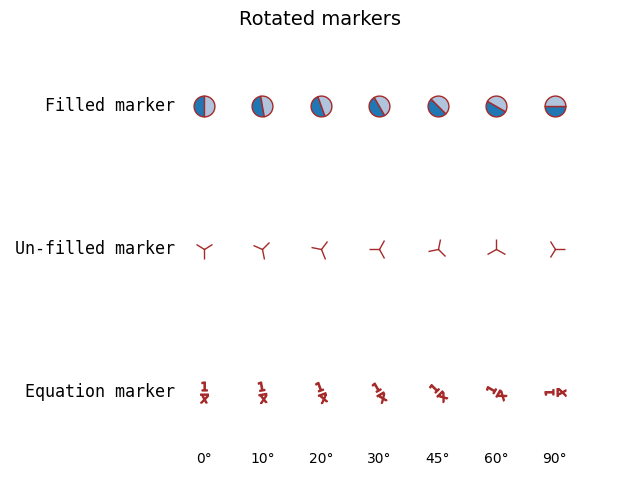
使用轉換的高階標記符號修改#
透過將轉換傳遞至 MarkerStyle 建構函式可以修改標記符號。以下範例顯示如何將提供的旋轉套用到數個標記符號形狀。
common_style = {k: v for k, v in filled_marker_style.items() if k != 'marker'}
angles = [0, 10, 20, 30, 45, 60, 90]

fig, ax = plt.subplots()
fig.suptitle('Rotated markers', fontsize=14)

ax.text(-0.5, 0, 'Filled marker', **text_style)
for x, theta in enumerate(angles):
    t = Affine2D().rotate_deg(theta)
    ax.plot(x, 0, marker=MarkerStyle('o', 'left', t), **common_style)

ax.text(-0.5, 1, 'Un-filled marker', **text_style)
for x, theta in enumerate(angles):
    t = Affine2D().rotate_deg(theta)
    ax.plot(x, 1, marker=MarkerStyle('1', 'left', t), **common_style)

ax.text(-0.5, 2, 'Equation marker', **text_style)
for x, theta in enumerate(angles):
    t = Affine2D().rotate_deg(theta)
    eq = r'$\frac{1}{x}$'
    ax.plot(x, 2, marker=MarkerStyle(eq, 'left', t), **common_style)

for x, theta in enumerate(angles):
    ax.text(x, 2.5, f"{theta}°", horizontalalignment="center")
format_axes(ax)

fig.tight_layout()
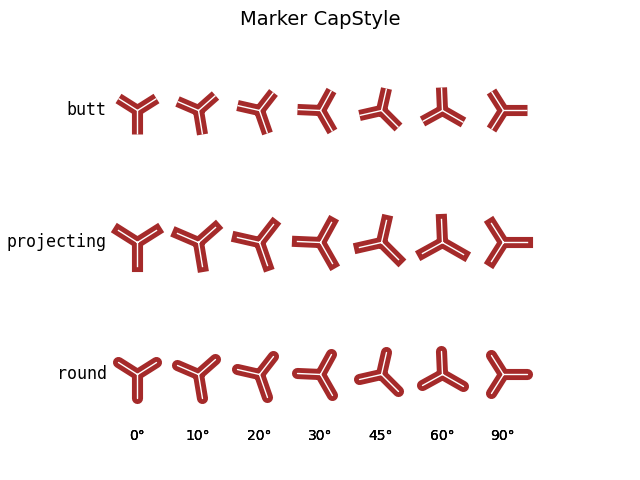
設定標記符號端點樣式和連接樣式#
標記符號具有預設端點和連接樣式,但建立 MarkerStyle 時可以自訂這些樣式。
from matplotlib.markers import CapStyle, JoinStyle

marker_inner = dict(markersize=35,
                    markerfacecolor='tab:blue',
                    markerfacecoloralt='lightsteelblue',
                    markeredgecolor='brown',
                    markeredgewidth=8,
                    )

marker_outer = dict(markersize=35,
                    markerfacecolor='tab:blue',
                    markerfacecoloralt='lightsteelblue',
                    markeredgecolor='white',
                    markeredgewidth=1,
                    )

fig, ax = plt.subplots()
fig.suptitle('Marker CapStyle', fontsize=14)
fig.subplots_adjust(left=0.1)

for y, cap_style in enumerate(CapStyle):
    ax.text(-0.5, y, cap_style.name, **text_style)
    for x, theta in enumerate(angles):
        t = Affine2D().rotate_deg(theta)
        m = MarkerStyle('1', transform=t, capstyle=cap_style)
        ax.plot(x, y, marker=m, **marker_inner)
        ax.plot(x, y, marker=m, **marker_outer)
        ax.text(x, len(CapStyle) - .5, f'{theta}°', ha='center')
format_axes(ax)
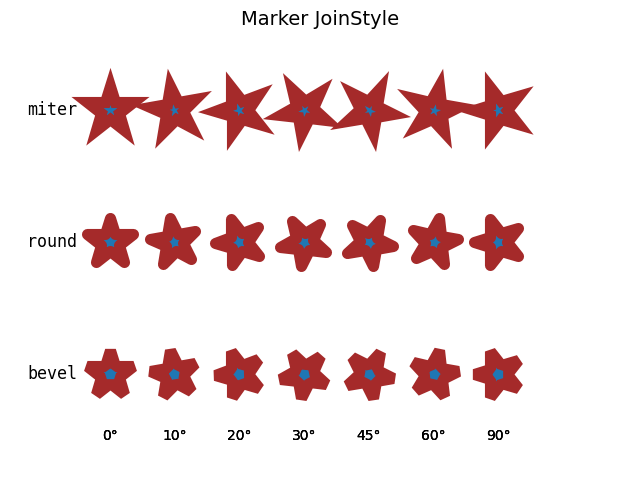
修改連接樣式
fig, ax = plt.subplots()
fig.suptitle('Marker JoinStyle', fontsize=14)
fig.subplots_adjust(left=0.05)

for y, join_style in enumerate(JoinStyle):
    ax.text(-0.5, y, join_style.name, **text_style)
    for x, theta in enumerate(angles):
        t = Affine2D().rotate_deg(theta)
        m = MarkerStyle('*', transform=t, joinstyle=join_style)
        ax.plot(x, y, marker=m, **marker_inner)
        ax.text(x, len(JoinStyle) - .5, f'{theta}°', ha='center')
format_axes(ax)

plt.show()
指令碼的總執行時間:(0 分鐘 5.257 秒)