注意
前往結尾 以下載完整的範例程式碼。
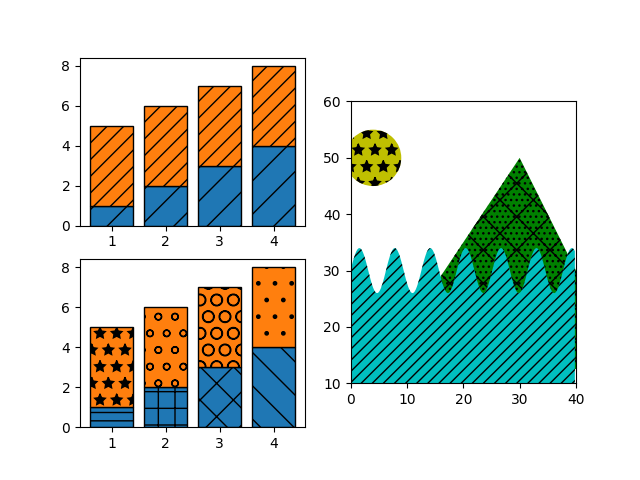
陰影線演示#
陰影線可以新增到 Matplotlib 中的大多數多邊形,包括 bar、fill_between、contourf,以及 Polygon 的子項目。它們目前在 PS、PDF、SVG、macosx 和 Agg 後端中受支援。WX 和 Cairo 後端目前不支援陰影線。
另請參閱 Contourf 陰影線,其中包含使用 contourf 的範例,以及 陰影線樣式參考,其中包含現有陰影線的樣本。
import matplotlib.pyplot as plt
import numpy as np

from matplotlib.patches import Ellipse, Polygon

x = np.arange(1, 5)
y1 = np.arange(1, 5)
y2 = np.ones(y1.shape) * 4

fig = plt.figure()
axs = fig.subplot_mosaic([['bar1', 'patches'], ['bar2', 'patches']])

axs['bar1'].bar(x, y1, edgecolor='black', hatch="/")
axs['bar1'].bar(x, y2, bottom=y1, edgecolor='black', hatch='//')

axs['bar2'].bar(x, y1, edgecolor='black', hatch=['--', '+', 'x', '\\'])
axs['bar2'].bar(x, y2, bottom=y1, edgecolor='black',
                hatch=['*', 'o', 'O', '.'])

x = np.arange(0, 40, 0.2)
axs['patches'].fill_between(x, np.sin(x) * 4 + 30, y2=0,
                            hatch='///', zorder=2, fc='c')
axs['patches'].add_patch(Ellipse((4, 50), 10, 10, fill=True,
                                 hatch='*', facecolor='y'))
axs['patches'].add_patch(Polygon([(10, 20), (30, 50), (50, 10)],
                                 hatch='\\/...', facecolor='g'))
axs['patches'].set_xlim([0, 40])
axs['patches'].set_ylim([10, 60])
axs['patches'].set_aspect(1)
plt.show()
參考
此範例中顯示了以下函數、方法、類別和模組的使用方式
腳本總執行時間: (0 分鐘 1.214 秒)