注意
跳到結尾以下載完整的範例程式碼。
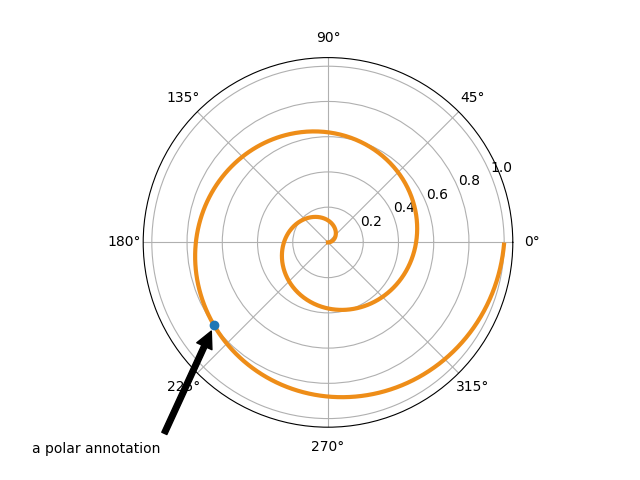
註解極座標圖#
這個範例展示如何在極座標圖上建立註解。
如需註解功能的完整概述,另請參閱註解。
import matplotlib.pyplot as plt
import numpy as np

fig = plt.figure()
ax = fig.add_subplot(projection='polar')
r = np.arange(0, 1, 0.001)
theta = 2 * 2*np.pi * r
line, = ax.plot(theta, r, color='#ee8d18', lw=3)

ind = 800
thisr, thistheta = r[ind], theta[ind]
ax.plot([thistheta], [thisr], 'o')
ax.annotate('a polar annotation',
            xy=(thistheta, thisr),  # theta, radius
            xytext=(0.05, 0.05),    # fraction, fraction
            textcoords='figure fraction',
            arrowprops=dict(facecolor='black', shrink=0.05),
            horizontalalignment='left',
            verticalalignment='bottom',
            )
plt.show()
參考
本範例中顯示了以下函數、方法、類別和模組的使用
指令碼的總執行時間: (0 分鐘 1.006 秒)