注意
前往結尾下載完整的範例程式碼。
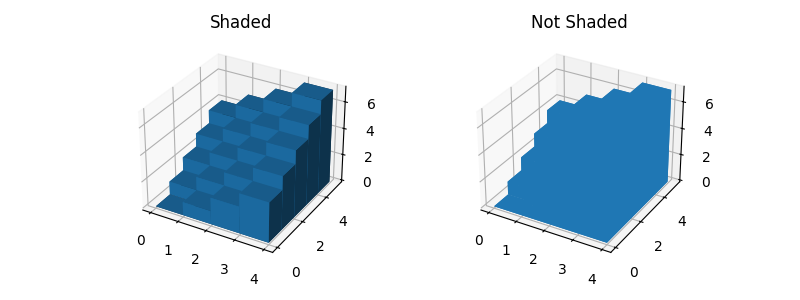
3D 長條圖演示#
如何繪製帶有和不帶有陰影的 3D 長條圖的基本演示。
import matplotlib.pyplot as plt
import numpy as np

# set up the figure and Axes
fig = plt.figure(figsize=(8, 3))
ax1 = fig.add_subplot(121, projection='3d')
ax2 = fig.add_subplot(122, projection='3d')

# fake data
_x = np.arange(4)
_y = np.arange(5)
_xx, _yy = np.meshgrid(_x, _y)
x, y = _xx.ravel(), _yy.ravel()

top = x + y
bottom = np.zeros_like(top)
width = depth = 1

ax1.bar3d(x, y, bottom, width, depth, top, shade=True)
ax1.set_title('Shaded')

ax2.bar3d(x, y, bottom, width, depth, top, shade=False)
ax2.set_title('Not Shaded')

plt.show()
腳本的總執行時間:(0 分鐘 1.035 秒)