注意
前往結尾以下載完整的範例程式碼。
座標報告#
在互動式後端中,覆寫預設的座標報告,因為滑鼠在軸上移動。
import matplotlib.pyplot as plt
import numpy as np
def millions(x):
return '$%1.1fM' % (x * 1e-6)
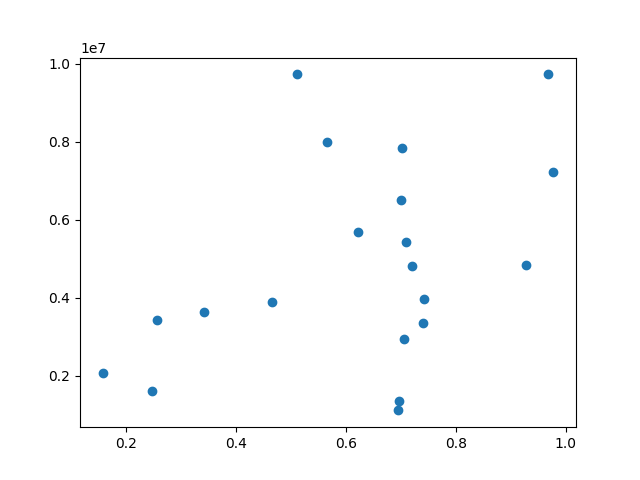
# Fixing random state for reproducibility
np.random.seed(19680801)
x = np.random.rand(20)
y = 1e7 * np.random.rand(20)
fig, ax = plt.subplots()
ax.fmt_ydata = millions
plt.plot(x, y, 'o')
plt.show()