注意
移至結尾以下載完整的範例程式碼。
自訂刻度器#
matplotlib.ticker 模組定義許多預設刻度器,但主要設計用於擴充性,即支援使用者自訂刻度。
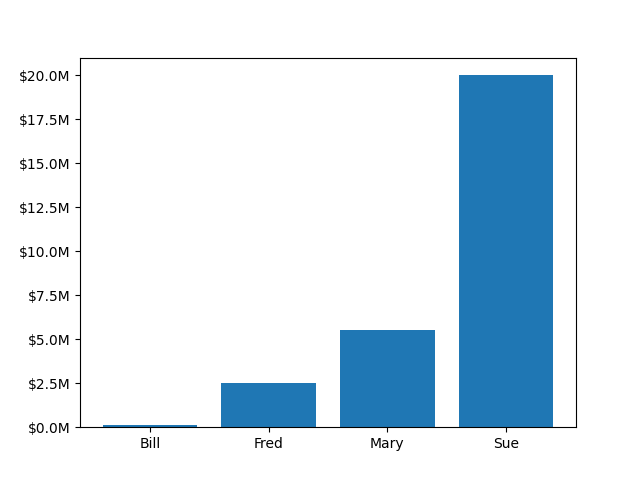
在此範例中,使用者定義的函數用於格式化 y 軸上以百萬美元為單位的刻度。
import matplotlib.pyplot as plt


def millions(x, pos):
    """The two arguments are the value and tick position."""
    return f'${x*1e-6:1.1f}M'


fig, ax = plt.subplots()
# set_major_formatter internally creates a FuncFormatter from the callable.
ax.yaxis.set_major_formatter(millions)
money = [1.5e5, 2.5e6, 5.5e6, 2.0e7]
ax.bar(['Bill', 'Fred', 'Mary', 'Sue'], money)
plt.show()