註解
移至結尾 以下載完整的範例程式碼。
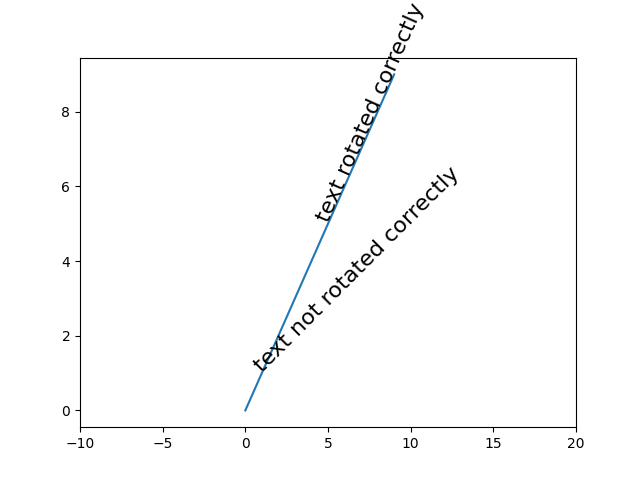
資料座標中的文字旋轉角度#
matplotlib 中的文字物件通常是相對於螢幕座標系統旋轉(例如,無論軸如何變化,45 度旋轉都會沿著水平和垂直之間的線條繪製文字)。然而,有時我們希望相對於圖表上的某個項目旋轉文字。在這種情況下,正確的角度不會是該物件在圖表座標系統中的角度,而是該物件在螢幕座標系統中「顯示」的角度。這個角度可以透過設定參數 *transform_rotates_text* 自動判斷,如下面的範例所示。
import matplotlib.pyplot as plt
import numpy as np

fig, ax = plt.subplots()

# Plot diagonal line (45 degrees)
h = ax.plot(range(0, 10), range(0, 10))

# set limits so that it no longer looks on screen to be 45 degrees
ax.set_xlim([-10, 20])

# Locations to plot text
l1 = np.array((1, 1))
l2 = np.array((5, 5))

# Rotate angle
angle = 45

# Plot text
th1 = ax.text(*l1, 'text not rotated correctly', fontsize=16,
              rotation=angle, rotation_mode='anchor')
th2 = ax.text(*l2, 'text rotated correctly', fontsize=16,
              rotation=angle, rotation_mode='anchor',
              transform_rotates_text=True)

plt.show()