註記
前往結尾以下載完整的範例程式碼。
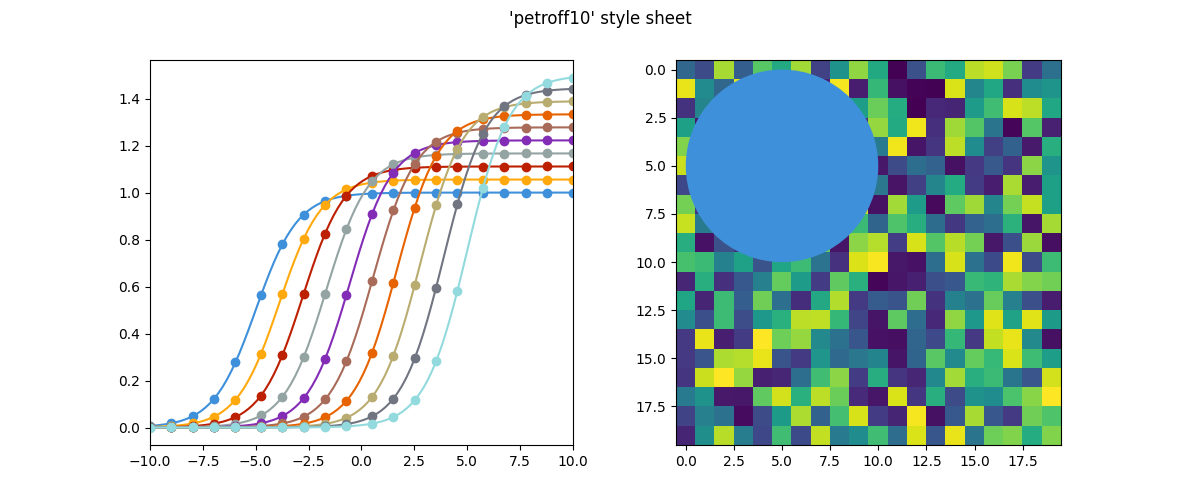
Petroff10 樣式表#
此範例示範 "petroff10" 樣式,該樣式實作了 Matthew A. Petroff [1] 開發的 10 色序列,用於方便存取的資料視覺化。此樣式平衡了美觀和易讀性的考量,使其適用於各種繪圖類型,同時確保資料系列的易讀性和區別度。
import matplotlib.pyplot as plt
import numpy as np


def colored_lines_example(ax):
    t = np.linspace(-10, 10, 100)
    nb_colors = len(plt.rcParams['axes.prop_cycle'])
    shifts = np.linspace(-5, 5, nb_colors)
    amplitudes = np.linspace(1, 1.5, nb_colors)
    for t0, a in zip(shifts, amplitudes):
        y = a / (1 + np.exp(-(t - t0)))
        line, = ax.plot(t, y, '-')
        point_indices = np.linspace(0, len(t) - 1, 20, dtype=int)
        ax.plot(t[point_indices], y[point_indices], 'o', color=line.get_color())
    ax.set_xlim(-10, 10)


def image_and_patch_example(ax):
    ax.imshow(np.random.random(size=(20, 20)), interpolation='none')
    c = plt.Circle((5, 5), radius=5, label='patch')
    ax.add_patch(c)

plt.style.use('petroff10')
fig, (ax1, ax2) = plt.subplots(ncols=2, figsize=(12, 5))
fig.suptitle("'petroff10' style sheet")
colored_lines_example(ax1)
image_and_patch_example(ax2)
plt.show()