注意
前往結尾以下載完整的範例程式碼。
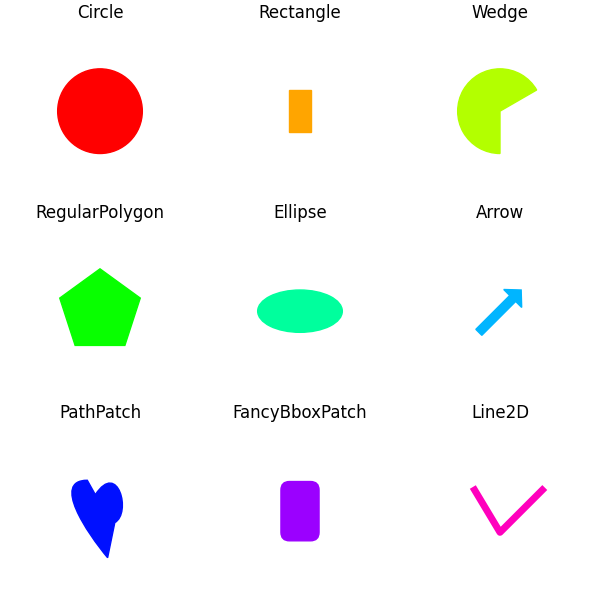
Matplotlib 藝術家參考#
此範例顯示 Matplotlib 的數個基本圖形(藝術家)。完整的藝術家清單記錄在藝術家 API。
另請參閱圓形、楔形和多邊形,它將所有藝術家分組到單個PatchCollection 中。
版權 (c) 2010, Bartosz Telenczuk BSD 授權
import matplotlib.pyplot as plt

import matplotlib as mpl
import matplotlib.lines as mlines
import matplotlib.patches as mpatches
import matplotlib.path as mpath

# Prepare the data for the PathPatch below.
Path = mpath.Path
codes, verts = zip(*[
    (Path.MOVETO, [0.018, -0.11]),
    (Path.CURVE4, [-0.031, -0.051]),
    (Path.CURVE4, [-0.115, 0.073]),
    (Path.CURVE4, [-0.03, 0.073]),
    (Path.LINETO, [-0.011, 0.039]),
    (Path.CURVE4, [0.043, 0.121]),
    (Path.CURVE4, [0.075, -0.005]),
    (Path.CURVE4, [0.035, -0.027]),
    (Path.CLOSEPOLY, [0.018, -0.11])])

artists = [
    mpatches.Circle((0, 0), 0.1, ec="none"),
    mpatches.Rectangle((-0.025, -0.05), 0.05, 0.1, ec="none"),
    mpatches.Wedge((0, 0), 0.1, 30, 270, ec="none"),
    mpatches.RegularPolygon((0, 0), 5, radius=0.1),
    mpatches.Ellipse((0, 0), 0.2, 0.1),
    mpatches.Arrow(-0.05, -0.05, 0.1, 0.1, width=0.1),
    mpatches.PathPatch(mpath.Path(verts, codes), ec="none"),
    mpatches.FancyBboxPatch((-0.025, -0.05), 0.05, 0.1, ec="none",
                            boxstyle=mpatches.BoxStyle("Round", pad=0.02)),
    mlines.Line2D([-0.06, 0.0, 0.1], [0.05, -0.05, 0.05], lw=5),
]

axs = plt.figure(figsize=(6, 6), layout="constrained").subplots(3, 3)
for i, (ax, artist) in enumerate(zip(axs.flat, artists)):
    artist.set(color=mpl.colormaps["hsv"](i / len(artists)))
    ax.add_artist(artist)
    ax.set(title=type(artist).__name__,
           aspect=1, xlim=(-.2, .2), ylim=(-.2, .2))
    ax.set_axis_off()
plt.show()
參考文獻
此範例中顯示下列函式、方法、類別和模組的使用方式
腳本的總執行時間: (0 分鐘 1.570 秒)