注意
跳至末尾以下載完整的範例程式碼。
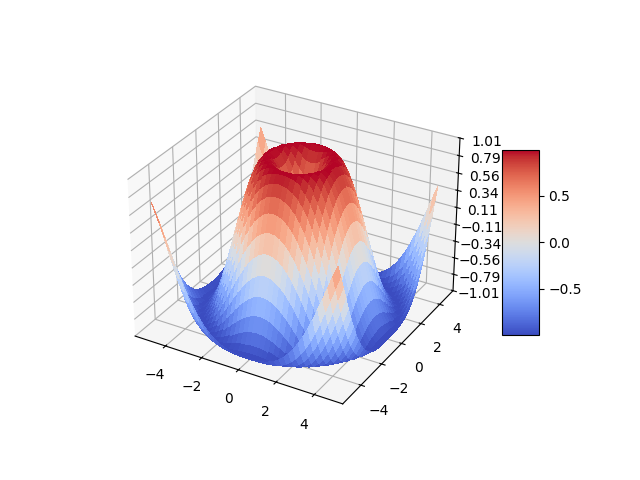
3D 表面(色彩圖)#
示範繪製使用 coolwarm 色彩圖著色的 3D 表面。 使用 antialiased=False 使表面不透明。
也示範使用 LinearLocator 和 z 軸刻度標籤的自訂格式設定。
import matplotlib.pyplot as plt
import numpy as np

from matplotlib import cm
from matplotlib.ticker import LinearLocator

fig, ax = plt.subplots(subplot_kw={"projection": "3d"})

# Make data.
X = np.arange(-5, 5, 0.25)
Y = np.arange(-5, 5, 0.25)
X, Y = np.meshgrid(X, Y)
R = np.sqrt(X**2 + Y**2)
Z = np.sin(R)

# Plot the surface.
surf = ax.plot_surface(X, Y, Z, cmap=cm.coolwarm,
                       linewidth=0, antialiased=False)

# Customize the z axis.
ax.set_zlim(-1.01, 1.01)
ax.zaxis.set_major_locator(LinearLocator(10))
# A StrMethodFormatter is used automatically
ax.zaxis.set_major_formatter('{x:.02f}')

# Add a color bar which maps values to colors.
fig.colorbar(surf, shrink=0.5, aspect=5)

plt.show()
參考
此範例中顯示下列函數、方法、類別和模組的用法
指令碼的總執行時間:(0 分鐘 1.687 秒)