注意
前往末端以下載完整的範例程式碼。
簡單軸分割器 1#
另請參閱 axes_grid1 工具組。
import matplotlib.pyplot as plt

from mpl_toolkits.axes_grid1 import Divider, Size


def label_axes(ax, text):
    """Place a label at the center of an Axes, and remove the axis ticks."""
    ax.text(.5, .5, text, transform=ax.transAxes,
            horizontalalignment="center", verticalalignment="center")
    ax.tick_params(bottom=False, labelbottom=False,
                   left=False, labelleft=False)
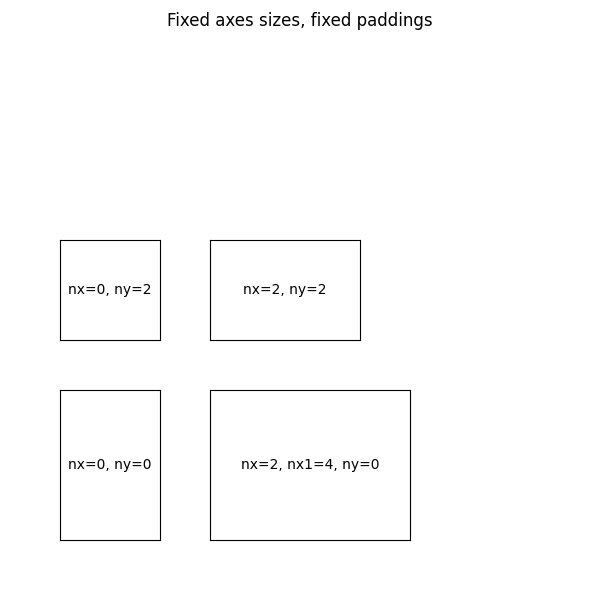
固定軸大小;固定邊距。
fig = plt.figure(figsize=(6, 6))
fig.suptitle("Fixed axes sizes, fixed paddings")

# Sizes are in inches.
horiz = [Size.Fixed(1.), Size.Fixed(.5), Size.Fixed(1.5), Size.Fixed(.5)]
vert = [Size.Fixed(1.5), Size.Fixed(.5), Size.Fixed(1.)]

rect = (0.1, 0.1, 0.8, 0.8)
# Divide the Axes rectangle into a grid with sizes specified by horiz * vert.
div = Divider(fig, rect, horiz, vert, aspect=False)

# The rect parameter will actually be ignored and overridden by axes_locator.
ax1 = fig.add_axes(rect, axes_locator=div.new_locator(nx=0, ny=0))
label_axes(ax1, "nx=0, ny=0")
ax2 = fig.add_axes(rect, axes_locator=div.new_locator(nx=0, ny=2))
label_axes(ax2, "nx=0, ny=2")
ax3 = fig.add_axes(rect, axes_locator=div.new_locator(nx=2, ny=2))
label_axes(ax3, "nx=2, ny=2")
ax4 = fig.add_axes(rect, axes_locator=div.new_locator(nx=2, nx1=4, ny=0))
label_axes(ax4, "nx=2, nx1=4, ny=0")
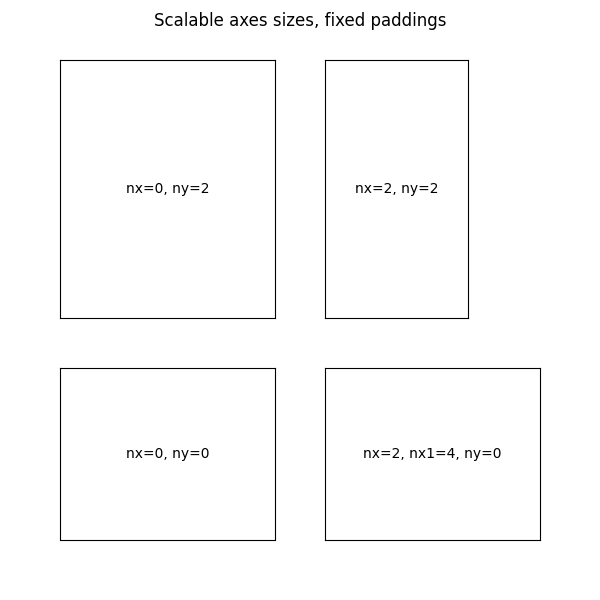
隨圖表大小縮放的軸大小;固定邊距。
fig = plt.figure(figsize=(6, 6))
fig.suptitle("Scalable axes sizes, fixed paddings")

horiz = [Size.Scaled(1.5), Size.Fixed(.5), Size.Scaled(1.), Size.Scaled(.5)]
vert = [Size.Scaled(1.), Size.Fixed(.5), Size.Scaled(1.5)]

rect = (0.1, 0.1, 0.8, 0.8)
# Divide the Axes rectangle into a grid with sizes specified by horiz * vert.
div = Divider(fig, rect, horiz, vert, aspect=False)

# The rect parameter will actually be ignored and overridden by axes_locator.
ax1 = fig.add_axes(rect, axes_locator=div.new_locator(nx=0, ny=0))
label_axes(ax1, "nx=0, ny=0")
ax2 = fig.add_axes(rect, axes_locator=div.new_locator(nx=0, ny=2))
label_axes(ax2, "nx=0, ny=2")
ax3 = fig.add_axes(rect, axes_locator=div.new_locator(nx=2, ny=2))
label_axes(ax3, "nx=2, ny=2")
ax4 = fig.add_axes(rect, axes_locator=div.new_locator(nx=2, nx1=4, ny=0))
label_axes(ax4, "nx=2, nx1=4, ny=0")

plt.show()