注意
前往結尾下載完整的範例程式碼。
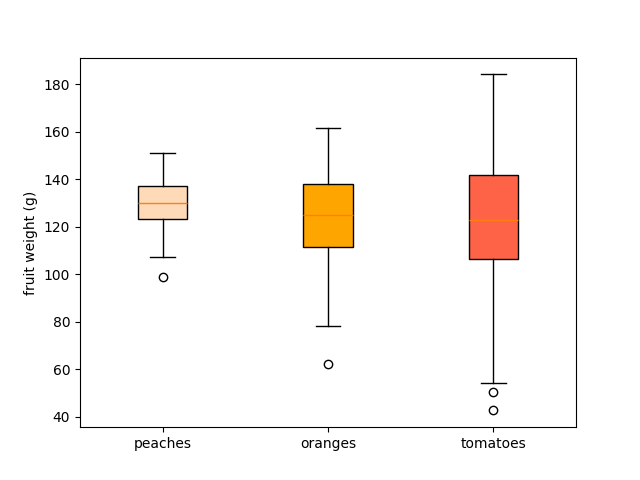
帶自訂填滿色彩的盒狀圖#
要個別為盒狀圖的每個方塊著色
使用關鍵字引數
patch_artist=True來建立填滿的方塊。迴圈遍歷已建立的方塊並調整其顏色。
import matplotlib.pyplot as plt
import numpy as np

np.random.seed(19680801)
fruit_weights = [
    np.random.normal(130, 10, size=100),
    np.random.normal(125, 20, size=100),
    np.random.normal(120, 30, size=100),
]
labels = ['peaches', 'oranges', 'tomatoes']
colors = ['peachpuff', 'orange', 'tomato']

fig, ax = plt.subplots()
ax.set_ylabel('fruit weight (g)')

bplot = ax.boxplot(fruit_weights,
                   patch_artist=True,  # fill with color
                   tick_labels=labels)  # will be used to label x-ticks

# fill with colors
for patch, color in zip(bplot['boxes'], colors):
    patch.set_facecolor(color)

plt.show()