注意
前往結尾以下載完整的範例程式碼。
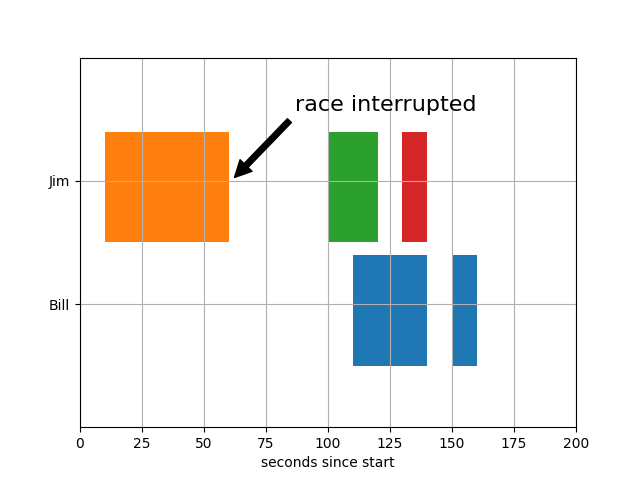
斷裂的水平長條圖#
製作一個「斷裂」的水平長條圖,即有間隙的長條圖
import matplotlib.pyplot as plt

# Horizontal bar plot with gaps
fig, ax = plt.subplots()
ax.broken_barh([(110, 30), (150, 10)], (10, 9), facecolors='tab:blue')
ax.broken_barh([(10, 50), (100, 20), (130, 10)], (20, 9),
               facecolors=('tab:orange', 'tab:green', 'tab:red'))
ax.set_ylim(5, 35)
ax.set_xlim(0, 200)
ax.set_xlabel('seconds since start')
ax.set_yticks([15, 25], labels=['Bill', 'Jim'])     # Modify y-axis tick labels
ax.grid(True)                                       # Make grid lines visible
ax.annotate('race interrupted', (61, 25),
            xytext=(0.8, 0.9), textcoords='axes fraction',
            arrowprops=dict(facecolor='black', shrink=0.05),
            fontsize=16,
            horizontalalignment='right', verticalalignment='top')

plt.show()