注意
跳到結尾以下載完整範例程式碼。
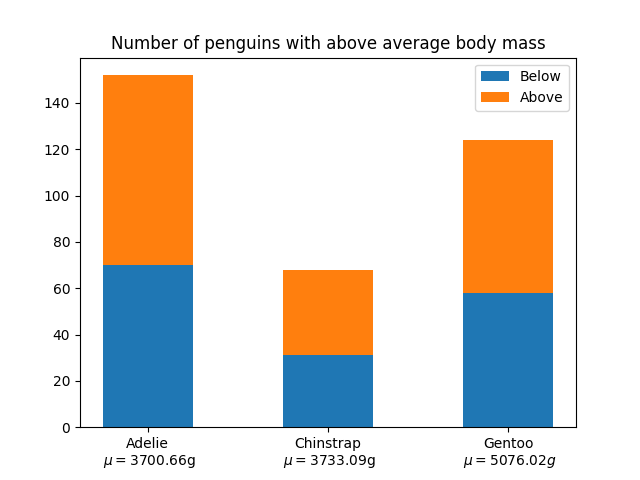
堆疊長條圖#
這是一個使用 bar 建立堆疊長條圖的範例。
import matplotlib.pyplot as plt
import numpy as np

# data from https://allisonhorst.github.io/palmerpenguins/

species = (
    "Adelie\n $\\mu=$3700.66g",
    "Chinstrap\n $\\mu=$3733.09g",
    "Gentoo\n $\\mu=5076.02g$",
)
weight_counts = {
    "Below": np.array([70, 31, 58]),
    "Above": np.array([82, 37, 66]),
}
width = 0.5

fig, ax = plt.subplots()
bottom = np.zeros(3)

for boolean, weight_count in weight_counts.items():
    p = ax.bar(species, weight_count, width, label=boolean, bottom=bottom)
    bottom += weight_count

ax.set_title("Number of penguins with above average body mass")
ax.legend(loc="upper right")

plt.show()
腳本的總執行時間:(0 分鐘 1.616 秒)