注意
跳到結尾以下載完整的範例程式碼。
標題定位#
Matplotlib 可以顯示居中、與軸集合左側對齊以及與軸集合右側對齊的繪圖標題。
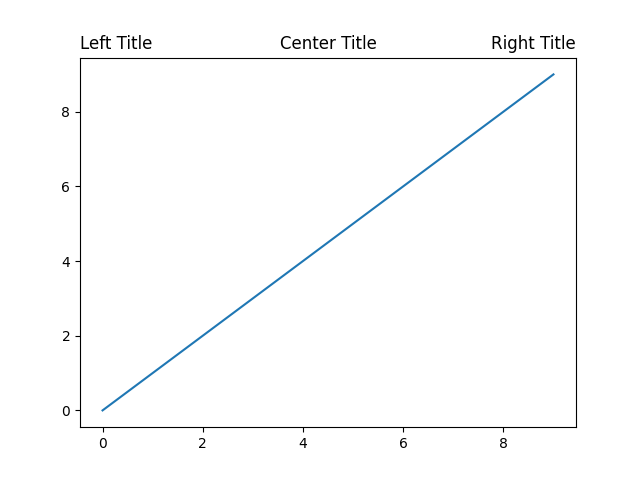
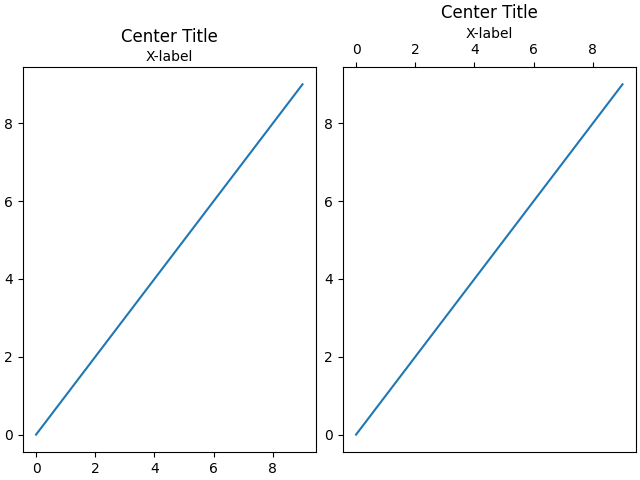
垂直位置會自動選擇,以避免最頂端 x 軸上的裝飾(即標籤和刻度)
fig, axs = plt.subplots(1, 2, layout='constrained')

ax = axs[0]
ax.plot(range(10))
ax.xaxis.set_label_position('top')
ax.set_xlabel('X-label')
ax.set_title('Center Title')

ax = axs[1]
ax.plot(range(10))
ax.xaxis.set_label_position('top')
ax.xaxis.tick_top()
ax.set_xlabel('X-label')
ax.set_title('Center Title')
plt.show()
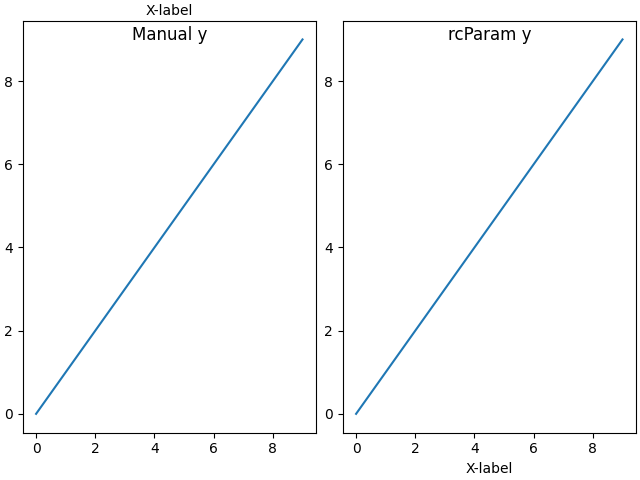
您可以手動為標題指定 *y* 關鍵字引數,或在 rcParams 中設定 rcParams["axes.titley"](預設值:None)來關閉自動定位。
fig, axs = plt.subplots(1, 2, layout='constrained')

ax = axs[0]
ax.plot(range(10))
ax.xaxis.set_label_position('top')
ax.set_xlabel('X-label')
ax.set_title('Manual y', y=1.0, pad=-14)

plt.rcParams['axes.titley'] = 1.0    # y is in axes-relative coordinates.
plt.rcParams['axes.titlepad'] = -14  # pad is in points...
ax = axs[1]
ax.plot(range(10))
ax.set_xlabel('X-label')
ax.set_title('rcParam y')

plt.show()
指令碼的總執行時間:(0 分鐘 2.142 秒)