注意
前往結尾下載完整範例程式碼。
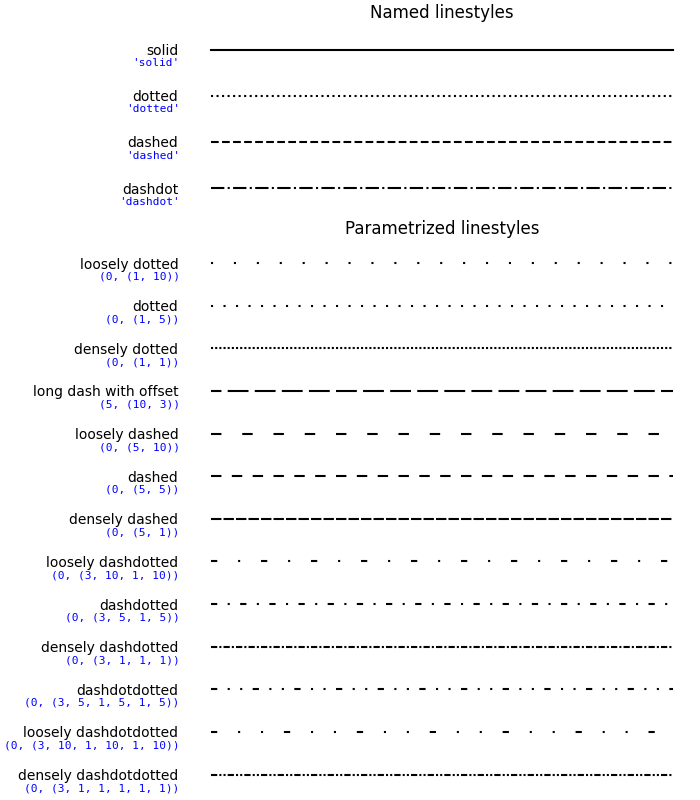
線條樣式#
可以使用字串 "solid"、"dotted"、"dashed" 或 "dashdot" 定義簡單的線條樣式。若要實現更精細的控制,可以提供虛線元組 (offset, (on_off_seq))。例如,(0, (3, 10, 1, 15)) 表示(3pt 線、10pt 間距、1pt 線、15pt 間距),沒有偏移;而 (5, (10, 3)),表示(10pt 線、3pt 間距),但跳過前 5pt 線。另請參閱 Line2D.set_linestyle。"dotted"、"dashed" 和 "dashdot" 樣式的特定開啟/關閉序列是可設定的。
rcParams["lines.dotted_pattern"](預設值:[1.0, 1.65])rcParams["lines.dashed_pattern"](預設值:[3.7, 1.6])rcParams["lines.dashdot_pattern"](預設值:[6.4, 1.6, 1.0, 1.6])
注意:虛線樣式也可以透過 Line2D.set_dashes 設定,如 虛線樣式組態 中所示,並將虛線序列列表傳遞給 property_cycle 中的循環器,並使用關鍵字 dashes。
import matplotlib.pyplot as plt
import numpy as np

linestyle_str = [
     ('solid', 'solid'),      # Same as (0, ()) or '-'
     ('dotted', 'dotted'),    # Same as ':'
     ('dashed', 'dashed'),    # Same as '--'
     ('dashdot', 'dashdot')]  # Same as '-.'

linestyle_tuple = [
     ('loosely dotted',        (0, (1, 10))),
     ('dotted',                (0, (1, 5))),
     ('densely dotted',        (0, (1, 1))),

     ('long dash with offset', (5, (10, 3))),
     ('loosely dashed',        (0, (5, 10))),
     ('dashed',                (0, (5, 5))),
     ('densely dashed',        (0, (5, 1))),

     ('loosely dashdotted',    (0, (3, 10, 1, 10))),
     ('dashdotted',            (0, (3, 5, 1, 5))),
     ('densely dashdotted',    (0, (3, 1, 1, 1))),

     ('dashdotdotted',         (0, (3, 5, 1, 5, 1, 5))),
     ('loosely dashdotdotted', (0, (3, 10, 1, 10, 1, 10))),
     ('densely dashdotdotted', (0, (3, 1, 1, 1, 1, 1)))]


def plot_linestyles(ax, linestyles, title):
    X, Y = np.linspace(0, 100, 10), np.zeros(10)
    yticklabels = []

    for i, (name, linestyle) in enumerate(linestyles):
        ax.plot(X, Y+i, linestyle=linestyle, linewidth=1.5, color='black')
        yticklabels.append(name)

    ax.set_title(title)
    ax.set(ylim=(-0.5, len(linestyles)-0.5),
           yticks=np.arange(len(linestyles)),
           yticklabels=yticklabels)
    ax.tick_params(left=False, bottom=False, labelbottom=False)
    ax.spines[:].set_visible(False)

    # For each line style, add a text annotation with a small offset from
    # the reference point (0 in Axes coords, y tick value in Data coords).
    for i, (name, linestyle) in enumerate(linestyles):
        ax.annotate(repr(linestyle),
                    xy=(0.0, i), xycoords=ax.get_yaxis_transform(),
                    xytext=(-6, -12), textcoords='offset points',
                    color="blue", fontsize=8, ha="right", family="monospace")


fig, (ax0, ax1) = plt.subplots(2, 1, figsize=(7, 8), height_ratios=[1, 3],
                               layout='constrained')

plot_linestyles(ax0, linestyle_str[::-1], title='Named linestyles')
plot_linestyles(ax1, linestyle_tuple[::-1], title='Parametrized linestyles')

plt.show()
腳本的總執行時間:(0 分鐘 1.998 秒)