注意
跳到結尾以下載完整的範例程式碼。
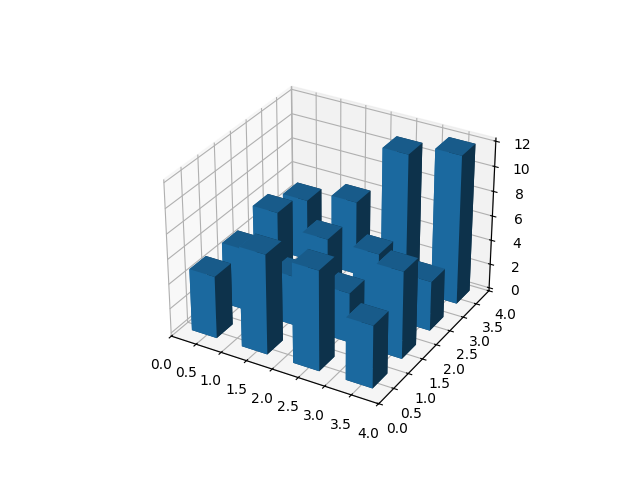
建立 2D 資料的 3D 直方圖#
以 3D 長條圖表示 2D 資料的直方圖示範。
import matplotlib.pyplot as plt
import numpy as np

# Fixing random state for reproducibility
np.random.seed(19680801)


fig = plt.figure()
ax = fig.add_subplot(projection='3d')
x, y = np.random.rand(2, 100) * 4
hist, xedges, yedges = np.histogram2d(x, y, bins=4, range=[[0, 4], [0, 4]])

# Construct arrays for the anchor positions of the 16 bars.
xpos, ypos = np.meshgrid(xedges[:-1] + 0.25, yedges[:-1] + 0.25, indexing="ij")
xpos = xpos.ravel()
ypos = ypos.ravel()
zpos = 0

# Construct arrays with the dimensions for the 16 bars.
dx = dy = 0.5 * np.ones_like(zpos)
dz = hist.ravel()

ax.bar3d(xpos, ypos, zpos, dx, dy, dz, zsort='average')

plt.show()
腳本的總執行時間: (0 分鐘 1.143 秒)