注意
前往結尾下載完整範例程式碼。
約束式佈局指南#
使用約束式佈局來將繪圖乾淨地放入圖表中。
約束式佈局會自動調整子圖,使刻度標籤、圖例和顏色條等裝飾不會重疊,同時仍保留使用者要求的邏輯佈局。
約束式佈局類似於緊湊佈局,但靈活度更高。它處理放置在多個軸上的顏色條(放置顏色條)、巢狀佈局(subfigures)以及跨越列或行的軸(subplot_mosaic),力求對齊同一行或列中軸的軸脊。此外,壓縮式佈局將嘗試將固定長寬比的軸更靠近。本文檔中將介紹這些功能,以及最後討論的一些實作細節。
約束式佈局通常需要在將任何軸新增到圖表之前啟動。有兩種方法可以做到這一點
使用
subplots、figure、subplot_mosaic的對應引數,例如plt.subplots(layout="constrained")
透過rcParams啟動它,如
plt.rcParams['figure.constrained_layout.use'] = True
這些將在以下各節中詳細說明。
警告
呼叫tight_layout將關閉約束式佈局!
簡單範例#
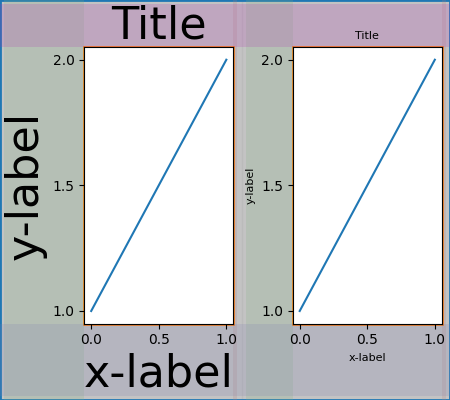
使用預設的軸位置,軸標題、軸標籤或刻度標籤有時可能會超出圖表區域,因而被裁剪。
import matplotlib.pyplot as plt
import numpy as np

import matplotlib.colors as mcolors
import matplotlib.gridspec as gridspec

plt.rcParams['savefig.facecolor'] = "0.8"
plt.rcParams['figure.figsize'] = 4.5, 4.
plt.rcParams['figure.max_open_warning'] = 50


def example_plot(ax, fontsize=12, hide_labels=False):
    ax.plot([1, 2])

    ax.locator_params(nbins=3)
    if hide_labels:
        ax.set_xticklabels([])
        ax.set_yticklabels([])
    else:
        ax.set_xlabel('x-label', fontsize=fontsize)
        ax.set_ylabel('y-label', fontsize=fontsize)
        ax.set_title('Title', fontsize=fontsize)

fig, ax = plt.subplots(layout=None)
example_plot(ax, fontsize=24)
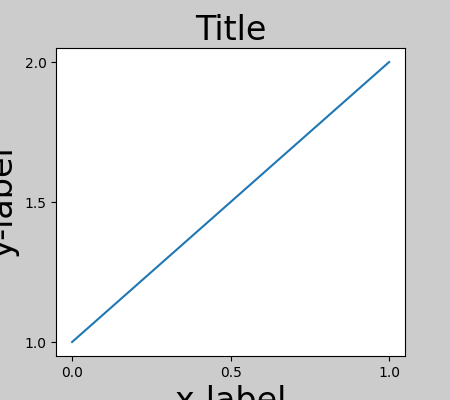
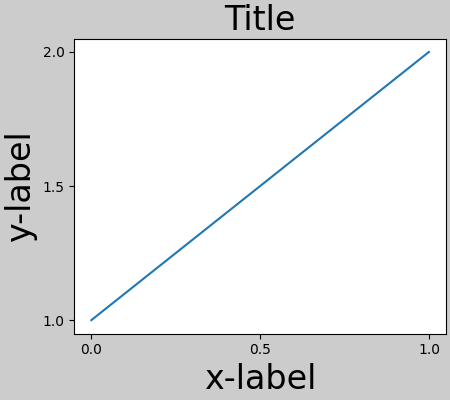
為了防止這種情況,需要調整軸的位置。對於子圖,可以使用Figure.subplots_adjust手動調整子圖參數來完成。但是,使用 layout="constrained" 關鍵字引數指定圖表將自動進行調整。
fig, ax = plt.subplots(layout="constrained")
example_plot(ax, fontsize=24)
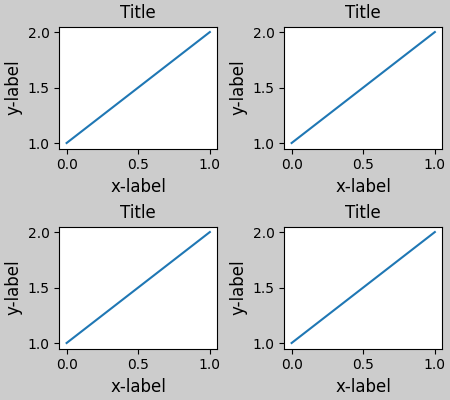
當有多個子圖時,經常會看到不同軸的標籤彼此重疊。
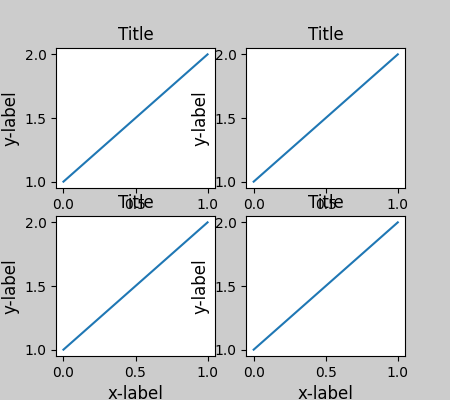
在呼叫 plt.subplots 時指定 layout="constrained" 會導致佈局被正確約束。
顏色條#
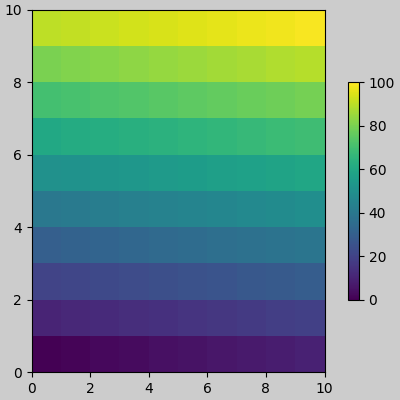
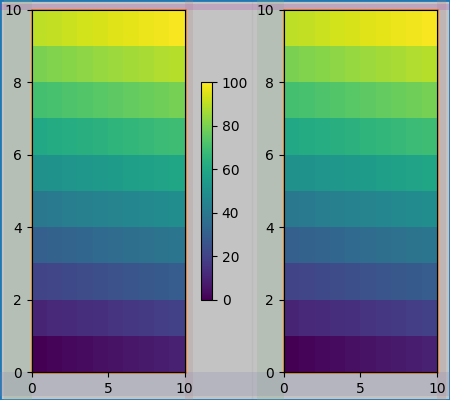
如果使用 Figure.colorbar 建立顏色條,則需要為其騰出空間。約束式佈局會自動執行此操作。請注意,如果指定 use_gridspec=True,它將被忽略,因為此選項是為了透過 tight_layout 改善佈局。
注意
對於 pcolormesh 關鍵字引數(pc_kwargs),我們使用字典來保持本文檔中的呼叫一致。
arr = np.arange(100).reshape((10, 10))
norm = mcolors.Normalize(vmin=0., vmax=100.)
# see note above: this makes all pcolormesh calls consistent:
pc_kwargs = {'rasterized': True, 'cmap': 'viridis', 'norm': norm}
fig, ax = plt.subplots(figsize=(4, 4), layout="constrained")
im = ax.pcolormesh(arr, **pc_kwargs)
fig.colorbar(im, ax=ax, shrink=0.6)
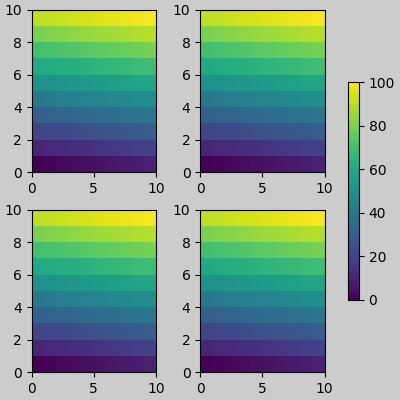
如果向 colorbar 的 ax 引數指定軸列表(或其他可迭代容器),約束式佈局將從指定的軸中取得空間。
fig, axs = plt.subplots(2, 2, figsize=(4, 4), layout="constrained")
for ax in axs.flat:
    im = ax.pcolormesh(arr, **pc_kwargs)
fig.colorbar(im, ax=axs, shrink=0.6)
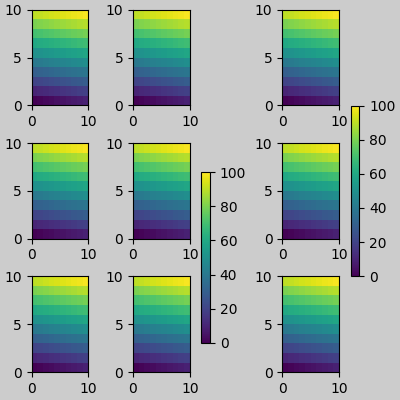
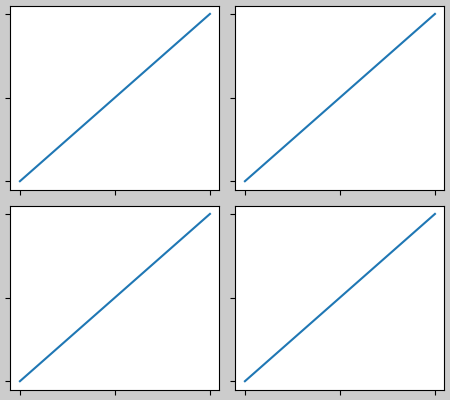
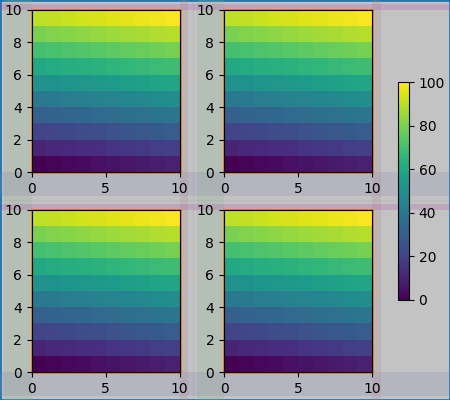
如果從軸網格內部指定軸列表,顏色條將適當地佔用空間並留下間隙,但所有子圖的大小仍會相同。
fig, axs = plt.subplots(3, 3, figsize=(4, 4), layout="constrained")
for ax in axs.flat:
    im = ax.pcolormesh(arr, **pc_kwargs)
fig.colorbar(im, ax=axs[1:, 1], shrink=0.8)
fig.colorbar(im, ax=axs[:, -1], shrink=0.6)
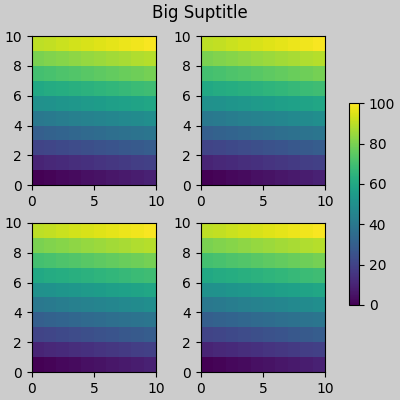
Suptitle#
約束式佈局也可以為 suptitle 騰出空間。
fig, axs = plt.subplots(2, 2, figsize=(4, 4), layout="constrained")
for ax in axs.flat:
    im = ax.pcolormesh(arr, **pc_kwargs)
fig.colorbar(im, ax=axs, shrink=0.6)
fig.suptitle('Big Suptitle')
圖例#
圖例可以放置在其父軸的外部。約束式佈局旨在為 Axes.legend()處理此問題。但是,約束式佈局尚未處理透過 Figure.legend()建立的圖例。
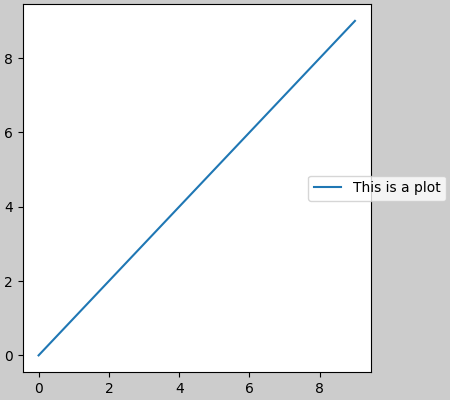
但是,這將從子圖佈局中佔用空間
為了使圖例或其他繪圖物件不佔用子圖佈局的空間,我們可以 leg.set_in_layout(False)。當然,這可能表示圖例最終被裁剪,但如果隨後使用 fig.savefig('outname.png', bbox_inches='tight') 呼叫繪圖,則可能很有用。但是,請注意,必須再次切換圖例的 get_in_layout 狀態才能使儲存的檔案正常運作,而且如果希望約束式佈局在列印之前調整軸的大小,則必須手動觸發繪製。
fig, axs = plt.subplots(1, 2, figsize=(4, 2), layout="constrained")

axs[0].plot(np.arange(10))
axs[1].plot(np.arange(10), label='This is a plot')
leg = axs[1].legend(loc='center left', bbox_to_anchor=(0.8, 0.5))
leg.set_in_layout(False)
# trigger a draw so that constrained layout is executed once
# before we turn it off when printing....
fig.canvas.draw()
# we want the legend included in the bbox_inches='tight' calcs.
leg.set_in_layout(True)
# we don't want the layout to change at this point.
fig.set_layout_engine('none')
try:
    fig.savefig('../../../doc/_static/constrained_layout_1b.png',
                bbox_inches='tight', dpi=100)
except FileNotFoundError:
    # this allows the script to keep going if run interactively and
    # the directory above doesn't exist
    pass
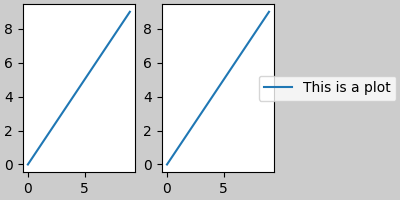
儲存的檔案如下所示
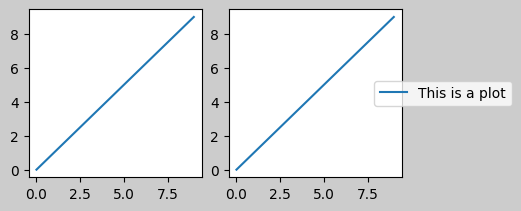
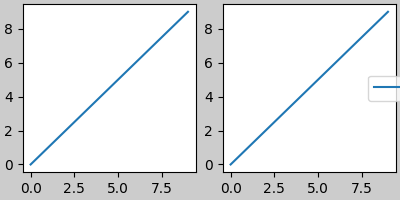
解決這種尷尬情況的更好方法是直接使用 Figure.legend 提供的圖例方法
fig, axs = plt.subplots(1, 2, figsize=(4, 2), layout="constrained")
axs[0].plot(np.arange(10))
lines = axs[1].plot(np.arange(10), label='This is a plot')
labels = [l.get_label() for l in lines]
leg = fig.legend(lines, labels, loc='center left',
                 bbox_to_anchor=(0.8, 0.5), bbox_transform=axs[1].transAxes)
try:
    fig.savefig('../../../doc/_static/constrained_layout_2b.png',
                bbox_inches='tight', dpi=100)
except FileNotFoundError:
    # this allows the script to keep going if run interactively and
    # the directory above doesn't exist
    pass

儲存的檔案如下所示

邊框間距和間隔#
軸之間的邊框間距在水平方向由 w_pad 和 wspace 控制,在垂直方向由 h_pad 和 hspace 控制。這些可以透過 set 編輯。w/h_pad 是軸周圍的最小空間,單位為英寸
fig, axs = plt.subplots(2, 2, layout="constrained")
for ax in axs.flat:
    example_plot(ax, hide_labels=True)
fig.get_layout_engine().set(w_pad=4 / 72, h_pad=4 / 72, hspace=0,
                            wspace=0)
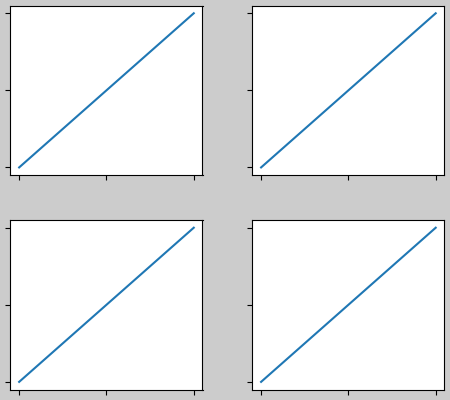
子圖之間的間隔進一步由 wspace 和 hspace 設定。這些被指定為子圖組整體大小的分數。如果這些值小於 w_pad 或 h_pad,則改用固定的邊框間距。請注意以下內容,邊緣的空間與上面的空間沒有變化,但子圖之間的空間發生了變化。
fig, axs = plt.subplots(2, 2, layout="constrained")
for ax in axs.flat:
    example_plot(ax, hide_labels=True)
fig.get_layout_engine().set(w_pad=4 / 72, h_pad=4 / 72, hspace=0.2,
                            wspace=0.2)
如果有兩個以上的列,則 wspace 在它們之間共享,因此此處的 wspace 分成兩部分,每列之間的 wspace 為 0.1
fig, axs = plt.subplots(2, 3, layout="constrained")
for ax in axs.flat:
    example_plot(ax, hide_labels=True)
fig.get_layout_engine().set(w_pad=4 / 72, h_pad=4 / 72, hspace=0.2,
                            wspace=0.2)

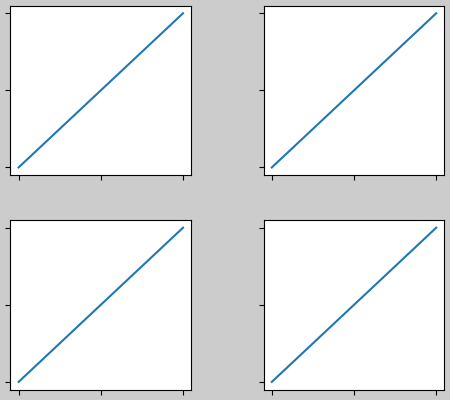
GridSpec 也有可選的 hspace 和 wspace 關鍵字引數,它們將被用來取代 約束式佈局 設定的邊框間距
fig, axs = plt.subplots(2, 2, layout="constrained",
                        gridspec_kw={'wspace': 0.3, 'hspace': 0.2})
for ax in axs.flat:
    example_plot(ax, hide_labels=True)
# this has no effect because the space set in the gridspec trumps the
# space set in *constrained layout*.
fig.get_layout_engine().set(w_pad=4 / 72, h_pad=4 / 72, hspace=0.0,
                            wspace=0.0)
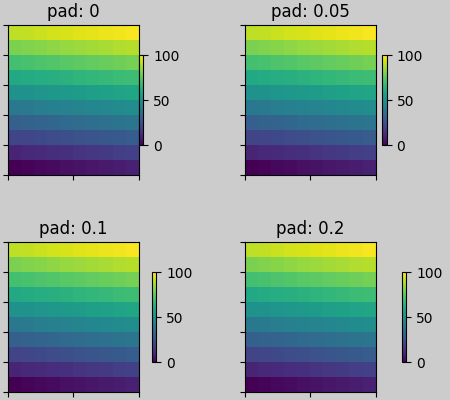
使用顏色條的間隔#
顏色條與其父物件之間會保持 pad 的距離,其中 pad 是父物件寬度的一部分。然後,到下一個子圖的間距由 w/hspace 給定。
fig, axs = plt.subplots(2, 2, layout="constrained")
pads = [0, 0.05, 0.1, 0.2]
for pad, ax in zip(pads, axs.flat):
    pc = ax.pcolormesh(arr, **pc_kwargs)
    fig.colorbar(pc, ax=ax, shrink=0.6, pad=pad)
    ax.set_xticklabels([])
    ax.set_yticklabels([])
    ax.set_title(f'pad: {pad}')
fig.get_layout_engine().set(w_pad=2 / 72, h_pad=2 / 72, hspace=0.2,
                            wspace=0.2)
rcParams#
有五個 rcParams 可以設定,可以在腳本中或在 matplotlibrc 檔案中設定。它們都有 figure.constrained_layout 的前綴。
use:是否使用約束式佈局。預設值為 False。
w_pad、h_pad:軸物件周圍的間距。浮點數表示英吋。預設值為 3./72 英吋 (3 點)。
wspace、hspace:子圖組之間的間距。浮點數表示分隔的子圖寬度的一部分。預設值為 0.02。
plt.rcParams['figure.constrained_layout.use'] = True
fig, axs = plt.subplots(2, 2, figsize=(3, 3))
for ax in axs.flat:
    example_plot(ax)
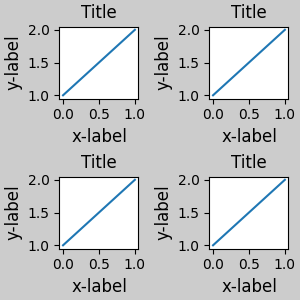
與 GridSpec 一起使用#
約束式佈局 旨在與 subplots()、subplot_mosaic() 或 GridSpec() 與 add_subplot() 一起使用。
請注意,在接下來的內容中,layout="constrained"
plt.rcParams['figure.constrained_layout.use'] = False
fig = plt.figure(layout="constrained")

gs1 = gridspec.GridSpec(2, 1, figure=fig)
ax1 = fig.add_subplot(gs1[0])
ax2 = fig.add_subplot(gs1[1])

example_plot(ax1)
example_plot(ax2)
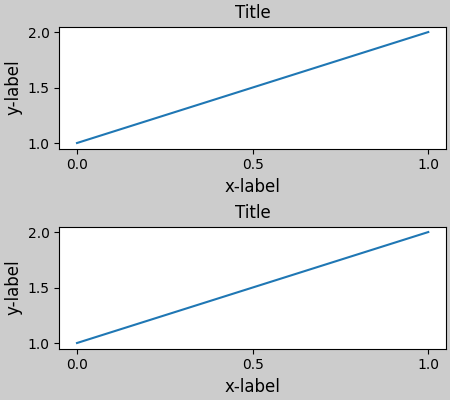
可以實現更複雜的 gridspec 佈局。請注意,這裡我們使用便捷函數 add_gridspec 和 subgridspec。
fig = plt.figure(layout="constrained")

gs0 = fig.add_gridspec(1, 2)

gs1 = gs0[0].subgridspec(2, 1)
ax1 = fig.add_subplot(gs1[0])
ax2 = fig.add_subplot(gs1[1])

example_plot(ax1)
example_plot(ax2)

gs2 = gs0[1].subgridspec(3, 1)

for ss in gs2:
    ax = fig.add_subplot(ss)
    example_plot(ax)
    ax.set_title("")
    ax.set_xlabel("")

ax.set_xlabel("x-label", fontsize=12)
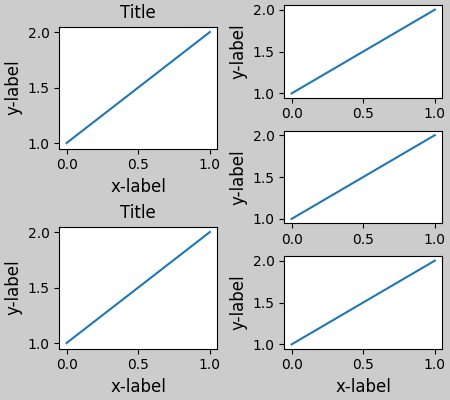
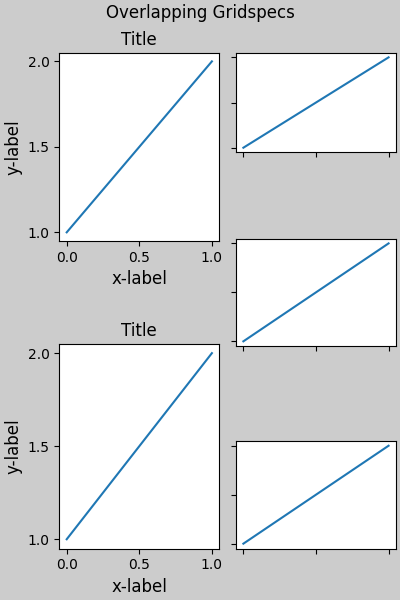
請注意,在上述範例中,左右兩欄的垂直範圍不同。如果我們希望兩個網格的頂部和底部對齊,則它們需要位於同一個 gridspec 中。我們也需要將此圖放大,以使軸不會縮小到零高度。
fig = plt.figure(figsize=(4, 6), layout="constrained")

gs0 = fig.add_gridspec(6, 2)

ax1 = fig.add_subplot(gs0[:3, 0])
ax2 = fig.add_subplot(gs0[3:, 0])

example_plot(ax1)
example_plot(ax2)

ax = fig.add_subplot(gs0[0:2, 1])
example_plot(ax, hide_labels=True)
ax = fig.add_subplot(gs0[2:4, 1])
example_plot(ax, hide_labels=True)
ax = fig.add_subplot(gs0[4:, 1])
example_plot(ax, hide_labels=True)
fig.suptitle('Overlapping Gridspecs')
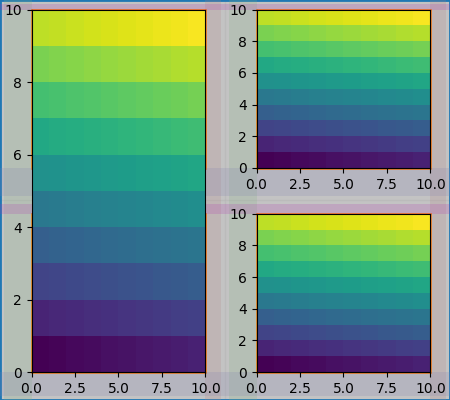
此範例使用兩個 gridspecs,使顏色條僅適用於一組 pcolors。請注意,由於此原因,左欄比右邊的兩個欄更寬。當然,如果您希望子圖大小相同,則只需要一個 gridspec。請注意,使用 subfigures 也可以達到相同的效果。
fig = plt.figure(layout="constrained")
gs0 = fig.add_gridspec(1, 2, figure=fig, width_ratios=[1, 2])
gs_left = gs0[0].subgridspec(2, 1)
gs_right = gs0[1].subgridspec(2, 2)

for gs in gs_left:
    ax = fig.add_subplot(gs)
    example_plot(ax)
axs = []
for gs in gs_right:
    ax = fig.add_subplot(gs)
    pcm = ax.pcolormesh(arr, **pc_kwargs)
    ax.set_xlabel('x-label')
    ax.set_ylabel('y-label')
    ax.set_title('title')
    axs += [ax]
fig.suptitle('Nested plots using subgridspec')
fig.colorbar(pcm, ax=axs)

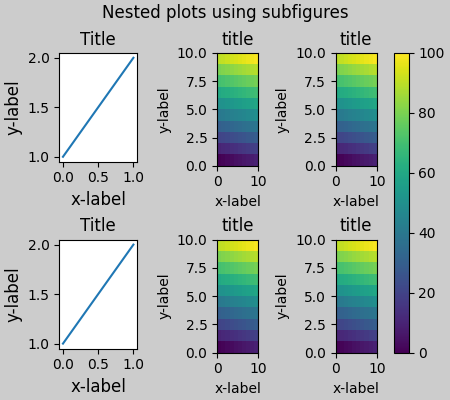
Matplotlib 現在提供 subfigures 而不是使用 subgridspecs,它也適用於約束式佈局。
fig = plt.figure(layout="constrained")
sfigs = fig.subfigures(1, 2, width_ratios=[1, 2])

axs_left = sfigs[0].subplots(2, 1)
for ax in axs_left.flat:
    example_plot(ax)

axs_right = sfigs[1].subplots(2, 2)
for ax in axs_right.flat:
    pcm = ax.pcolormesh(arr, **pc_kwargs)
    ax.set_xlabel('x-label')
    ax.set_ylabel('y-label')
    ax.set_title('title')
fig.colorbar(pcm, ax=axs_right)
fig.suptitle('Nested plots using subfigures')
手動設定軸位置#
可能會有充分的理由手動設定軸位置。手動呼叫 set_position 將設定軸,以使約束式佈局對其不再產生任何影響。(請注意,約束式佈局仍然會為移動的軸留下空間)。
fig, axs = plt.subplots(1, 2, layout="constrained")
example_plot(axs[0], fontsize=12)
axs[1].set_position([0.2, 0.2, 0.4, 0.4])
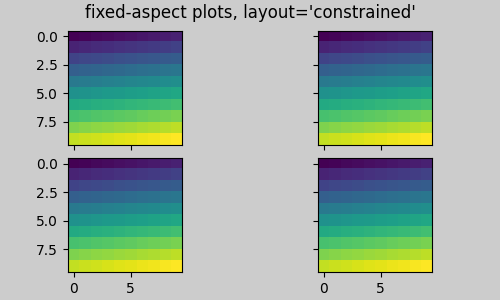
固定長寬比的軸網格:「壓縮」佈局#
約束式佈局 在軸的「原始」位置網格上運作。但是,當軸具有固定的長寬比時,通常會縮短一側,並在縮短的方向上留下很大的間隙。在以下範例中,軸是正方形,但圖形相當寬,因此存在水平間隙。
fig, axs = plt.subplots(2, 2, figsize=(5, 3),
                        sharex=True, sharey=True, layout="constrained")
for ax in axs.flat:
    ax.imshow(arr)
fig.suptitle("fixed-aspect plots, layout='constrained'")
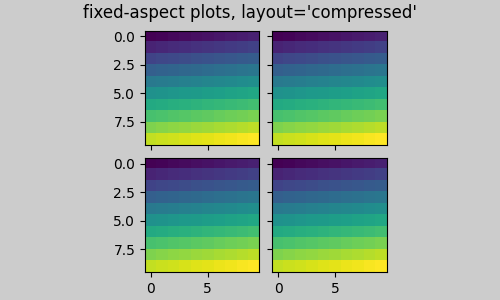
一種明顯的解決方法是使圖形大小更接近正方形,但是,要完全消除間隙,需要經過反覆試驗。對於簡單的軸網格,我們可以使用 layout="compressed" 來為我們完成這項工作。
fig, axs = plt.subplots(2, 2, figsize=(5, 3),
                        sharex=True, sharey=True, layout='compressed')
for ax in axs.flat:
    ax.imshow(arr)
fig.suptitle("fixed-aspect plots, layout='compressed'")
手動關閉約束式佈局#
約束式佈局 通常會在每次繪製圖形時調整軸的位置。如果您想要取得約束式佈局提供的間距,但不希望它更新,請執行初始繪製,然後呼叫 fig.set_layout_engine('none')。這對於刻度標籤可能變長的動畫來說可能很有用。
請注意,對於使用工具列的後端,約束式佈局 已針對 ZOOM 和 PAN GUI 事件關閉。這可以防止軸在縮放和平移期間改變位置。
限制#
不相容的函式#
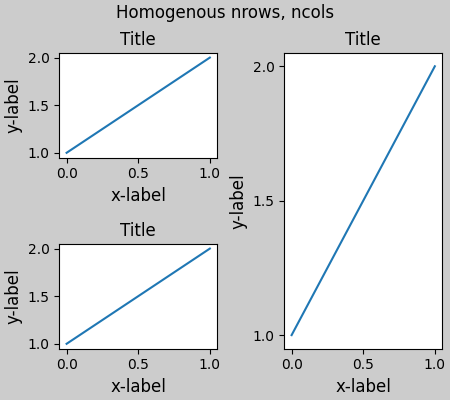
約束式佈局 可以與 pyplot.subplot 搭配使用,但前提是每次呼叫的行數和列數都相同。原因是,如果幾何形狀不同,每次呼叫 pyplot.subplot 都會建立一個新的 GridSpec 實例和約束式佈局。因此,以下內容可以正常運作。
fig = plt.figure(layout="constrained")

ax1 = plt.subplot(2, 2, 1)
ax2 = plt.subplot(2, 2, 3)
# third Axes that spans both rows in second column:
ax3 = plt.subplot(2, 2, (2, 4))

example_plot(ax1)
example_plot(ax2)
example_plot(ax3)
plt.suptitle('Homogenous nrows, ncols')
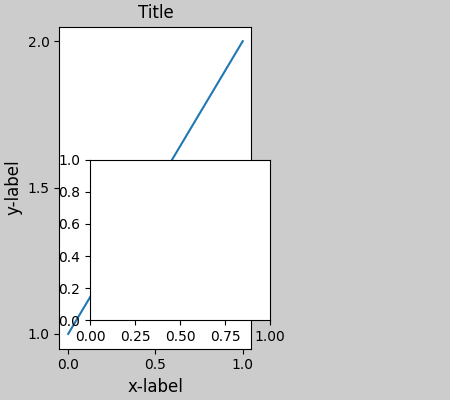
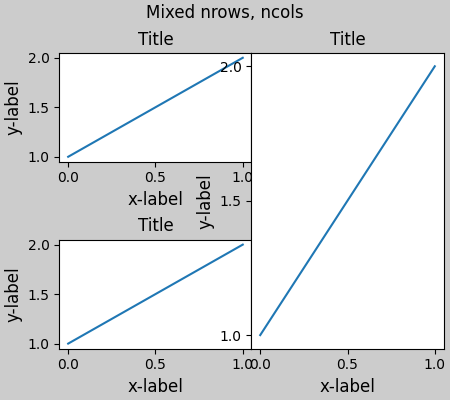
但以下內容會導致佈局不佳。
fig = plt.figure(layout="constrained")

ax1 = plt.subplot(2, 2, 1)
ax2 = plt.subplot(2, 2, 3)
ax3 = plt.subplot(1, 2, 2)

example_plot(ax1)
example_plot(ax2)
example_plot(ax3)
plt.suptitle('Mixed nrows, ncols')
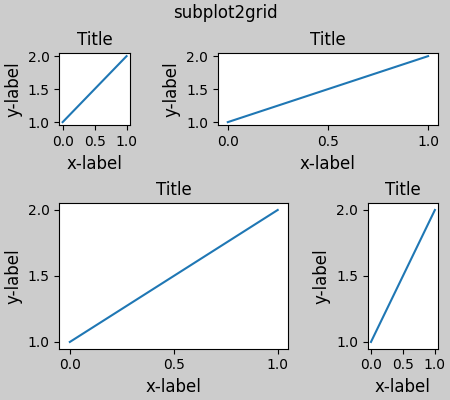
同樣,subplot2grid 也適用相同的限制,即 nrows 和 ncols 不能變更,佈局才能看起來良好。
fig = plt.figure(layout="constrained")

ax1 = plt.subplot2grid((3, 3), (0, 0))
ax2 = plt.subplot2grid((3, 3), (0, 1), colspan=2)
ax3 = plt.subplot2grid((3, 3), (1, 0), colspan=2, rowspan=2)
ax4 = plt.subplot2grid((3, 3), (1, 2), rowspan=2)

example_plot(ax1)
example_plot(ax2)
example_plot(ax3)
example_plot(ax4)
fig.suptitle('subplot2grid')
其他注意事項#
約束式佈局 只會考慮刻度標籤、軸標籤、標題和圖例。因此,其他繪圖物件可能會被剪裁,也可能會重疊。
它假設刻度標籤、軸標籤和標題所需的額外空間與軸的原始位置無關。這通常是真的,但在極少數情況下並非如此。
後端處理呈現字型的方式略有差異,因此結果不會完全相同。
當繪圖物件使用超出軸邊界的軸座標時,將繪圖物件新增至軸時,會導致不尋常的佈局。可以透過使用
add_artist()直接將繪圖物件新增至Figure來避免這種情況。請參閱ConnectionPatch以取得範例。
偵錯#
約束式佈局 可能會以有些意想不到的方式失敗。由於它使用約束求解器,因此求解器可能會找到在數學上正確,但完全不是使用者想要的解決方案。常見的失敗模式是所有大小都縮小到允許的最小值。如果發生這種情況,則是由於以下兩個原因之一。
您要求繪製的元素沒有足夠的空間。
存在錯誤 - 在這種情況下,請在 matplotlib/matplotlib#issues 開啟一個問題。
如果存在錯誤,請回報一個不需要外部資料或相依性(numpy 除外)的自我包含範例。
關於演算法的注意事項#
約束的演算法相對簡單,但由於我們可以佈置圖形的方式很複雜,因此具有一些複雜性。
Matplotlib 中的佈局是透過 GridSpec 類別透過 gridspecs 進行。gridspec 是將圖形邏輯劃分為多行和多列,其中這些行和列中的軸的相對寬度由 width_ratios 和 height_ratios 設定。
在約束式佈局中,每個 gridspec 都會獲得一個與其關聯的 layoutgrid。layoutgrid 的每一列都有一系列的 left 和 right 變數,每一行都有 bottom 和 top 變數,此外,它還具有左、右、下和上的邊距。在每一行中,底/上邊距會加寬,直到容納該行的所有裝飾符。同樣,對於列和左/右邊距。
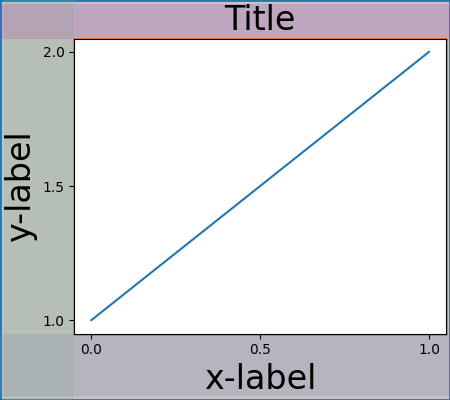
簡單情況:一個軸#
對於單個軸,佈局很簡單。有一個由單行和單列組成的圖形父 layoutgrid,以及一個由單行和單列組成的包含軸的 gridspec 子 layoutgrid。為軸的每一側的「裝飾」留出空間。在程式碼中,這是透過 do_constrained_layout() 中的項目來完成的,例如
gridspec._layoutgrid[0, 0].edit_margin_min('left',
      -bbox.x0 + pos.x0 + w_pad)
其中 bbox 是軸的緊密邊界框,而 pos 是其位置。請注意,四個邊距如何包含軸裝飾。
from matplotlib._layoutgrid import plot_children

fig, ax = plt.subplots(layout="constrained")
example_plot(ax, fontsize=24)
plot_children(fig)
簡單情況:兩個軸#
當有多個軸時,它們的佈局會以簡單的方式約束。在此範例中,左軸的裝飾比右軸大得多,但它們共用一個下邊距,該邊距會加大以容納較大的 xlabel。與共用的上邊距相同。左右邊距不會共用,因此允許不同。
兩個軸和顏色條#
顏色條只是擴展父 layoutgrid 單元格邊距的另一個項目
與 Gridspec 關聯的顏色條#
如果顏色條屬於網格的多個單元格,則會為每個單元格增加更大的邊距
fig, axs = plt.subplots(2, 2, layout="constrained")
for ax in axs.flat:
    im = ax.pcolormesh(arr, **pc_kwargs)
fig.colorbar(im, ax=axs, shrink=0.6)
plot_children(fig)
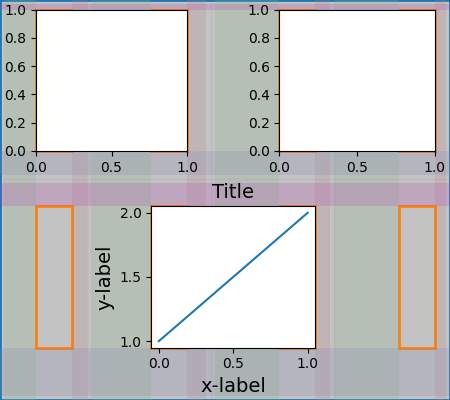
大小不均的軸#
有兩種方法可以在 Gridspec 佈局中使軸大小不均,一種是將它們指定為跨越 Gridspecs 行或列,另一種是指定寬度和高度比率。
此處使用第一種方法。請注意,中間的 top 和 bottom 邊界不受左側欄的影響。這是演算法刻意為之的決定,導致右側兩個軸的高度相同,但不是左側軸高度的 1/2。這與沒有約束佈局的情況下 gridspec 的運作方式一致。
fig = plt.figure(layout="constrained")
gs = gridspec.GridSpec(2, 2, figure=fig)
ax = fig.add_subplot(gs[:, 0])
im = ax.pcolormesh(arr, **pc_kwargs)
ax = fig.add_subplot(gs[0, 1])
im = ax.pcolormesh(arr, **pc_kwargs)
ax = fig.add_subplot(gs[1, 1])
im = ax.pcolormesh(arr, **pc_kwargs)
plot_children(fig)
一種需要微調的情況是,如果邊界沒有任何藝術家約束其寬度。在以下情況中,第 0 欄的右邊界和第 3 欄的左邊界沒有任何邊界藝術家來設定其寬度,因此我們取具有藝術家的邊界寬度的最大寬度。這使得所有軸都具有相同的大小
fig = plt.figure(layout="constrained")
gs = fig.add_gridspec(2, 4)
ax00 = fig.add_subplot(gs[0, 0:2])
ax01 = fig.add_subplot(gs[0, 2:])
ax10 = fig.add_subplot(gs[1, 1:3])
example_plot(ax10, fontsize=14)
plot_children(fig)
plt.show()
腳本總執行時間:(0 分鐘 23.357 秒)