注意
前往結尾以下載完整的範例程式碼。
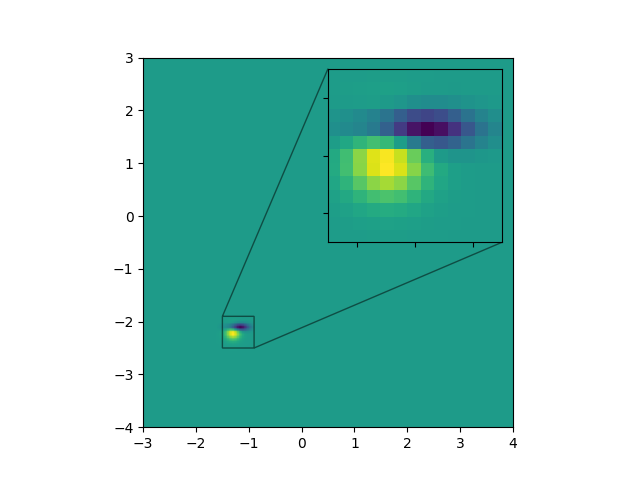
縮放區域插入軸#
插入軸的範例和一個矩形,顯示縮放的位置。
import numpy as np

from matplotlib import cbook
from matplotlib import pyplot as plt

fig, ax = plt.subplots()

# make data
Z = cbook.get_sample_data("axes_grid/bivariate_normal.npy")  # 15x15 array
Z2 = np.zeros((150, 150))
ny, nx = Z.shape
Z2[30:30+ny, 30:30+nx] = Z
extent = (-3, 4, -4, 3)

ax.imshow(Z2, extent=extent, origin="lower")

# inset Axes....
x1, x2, y1, y2 = -1.5, -0.9, -2.5, -1.9  # subregion of the original image
axins = ax.inset_axes(
    [0.5, 0.5, 0.47, 0.47],
    xlim=(x1, x2), ylim=(y1, y2), xticklabels=[], yticklabels=[])
axins.imshow(Z2, extent=extent, origin="lower")

ax.indicate_inset_zoom(axins, edgecolor="black")

plt.show()
參考資料
此範例中顯示了以下函式、方法、類別和模組的使用