注意
前往結尾下載完整的範例程式碼。
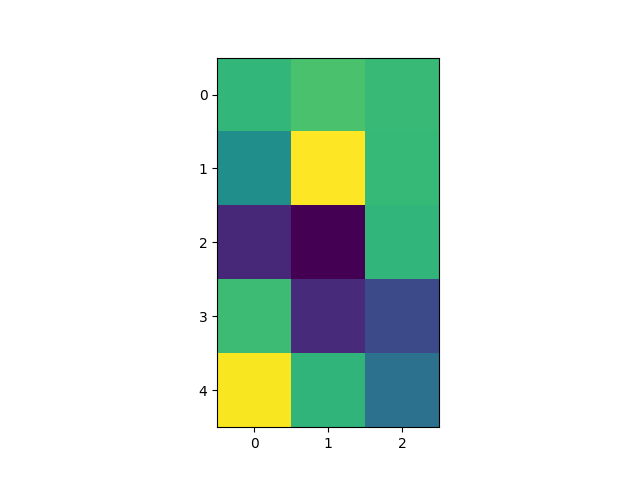
修改坐標格式化器#
修改坐標格式化器以報告給定 x 和 y 時最近像素的圖像「z」值。此功能預設內建;此範例僅展示如何自訂 format_coord 函數。
import matplotlib.pyplot as plt
import numpy as np

# Fixing random state for reproducibility
np.random.seed(19680801)


X = 10*np.random.rand(5, 3)

fig, ax = plt.subplots()
ax.imshow(X)


def format_coord(x, y):
    col = round(x)
    row = round(y)
    nrows, ncols = X.shape
    if 0 <= col < ncols and 0 <= row < nrows:
        z = X[row, col]
        return f'x={x:1.4f}, y={y:1.4f}, z={z:1.4f}'
    else:
        return f'x={x:1.4f}, y={y:1.4f}'


ax.format_coord = format_coord
plt.show()