註
跳到結尾以下載完整的範例程式碼。
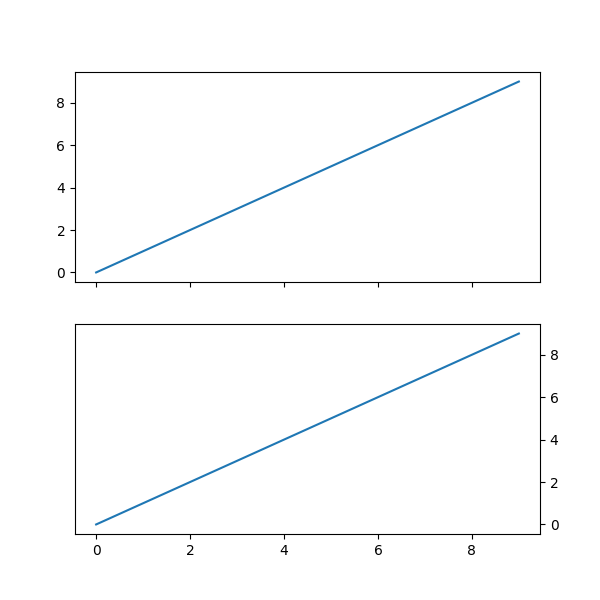
在右側設定預設 y 軸刻度標籤#
我們可以使用 rcParams["ytick.labelright"] (預設值: False), rcParams["ytick.right"] (預設值: False), rcParams["ytick.labelleft"] (預設值: True), 和 rcParams["ytick.left"] (預設值: True) 來控制刻度和其標籤在軸上的顯示位置。這些屬性也可以在 .matplotlib/matplotlibrc 中設定。
import matplotlib.pyplot as plt
import numpy as np

plt.rcParams['ytick.right'] = plt.rcParams['ytick.labelright'] = True
plt.rcParams['ytick.left'] = plt.rcParams['ytick.labelleft'] = False

x = np.arange(10)

fig, (ax0, ax1) = plt.subplots(2, 1, sharex=True, figsize=(6, 6))

ax0.plot(x)
ax0.yaxis.tick_left()

# use default parameter in rcParams, not calling tick_right()
ax1.plot(x)

plt.show()