注意
跳至結尾以下載完整的範例程式碼。
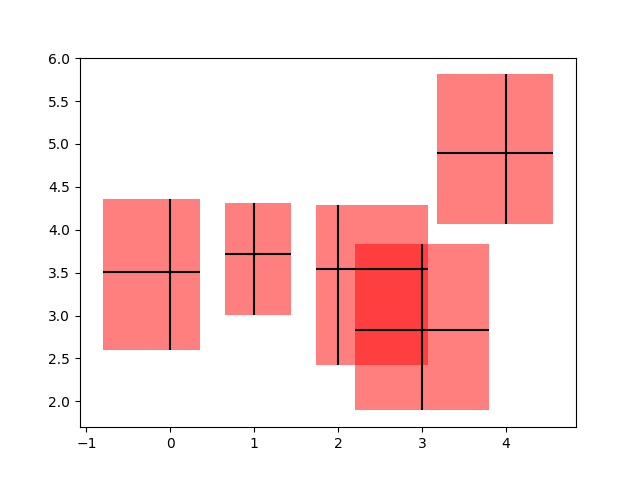
使用 PatchCollection 從誤差線建立方塊#
在這個範例中,我們透過新增一個矩形修補程式,該修補程式由 x 和 y 方向的線條限制定義,來美化一個相當標準的誤差線圖。 為此,我們必須編寫自己的自訂函數,稱為 make_error_boxes。仔細檢查此函數將會揭示用於編寫 matplotlib 函數的首選模式
將
Axes物件直接傳遞給函數該函數直接對
Axes方法進行操作,而不是透過pyplot介面可以縮寫的繪圖關鍵字引數被拼寫出來,以提高未來程式碼的可讀性(例如,我們使用 *facecolor* 而不是 *fc*)
Axes繪圖方法傳回的藝術家,然後由該函數傳回,以便在需要時,可以在函數外部修改其樣式(在此範例中未修改)。
import matplotlib.pyplot as plt
import numpy as np

from matplotlib.collections import PatchCollection
from matplotlib.patches import Rectangle

# Number of data points
n = 5

# Dummy data
np.random.seed(19680801)
x = np.arange(0, n, 1)
y = np.random.rand(n) * 5.

# Dummy errors (above and below)
xerr = np.random.rand(2, n) + 0.1
yerr = np.random.rand(2, n) + 0.2


def make_error_boxes(ax, xdata, ydata, xerror, yerror, facecolor='r',
                     edgecolor='none', alpha=0.5):

    # Loop over data points; create box from errors at each point
    errorboxes = [Rectangle((x - xe[0], y - ye[0]), xe.sum(), ye.sum())
                  for x, y, xe, ye in zip(xdata, ydata, xerror.T, yerror.T)]

    # Create patch collection with specified colour/alpha
    pc = PatchCollection(errorboxes, facecolor=facecolor, alpha=alpha,
                         edgecolor=edgecolor)

    # Add collection to Axes
    ax.add_collection(pc)

    # Plot errorbars
    artists = ax.errorbar(xdata, ydata, xerr=xerror, yerr=yerror,
                          fmt='none', ecolor='k')

    return artists


# Create figure and Axes
fig, ax = plt.subplots(1)

# Call function to create error boxes
_ = make_error_boxes(ax, x, y, xerr, yerr)

plt.show()
參考資料
本範例中顯示下列函數、方法、類別和模組的使用