注意
前往結尾以下載完整的範例程式碼。
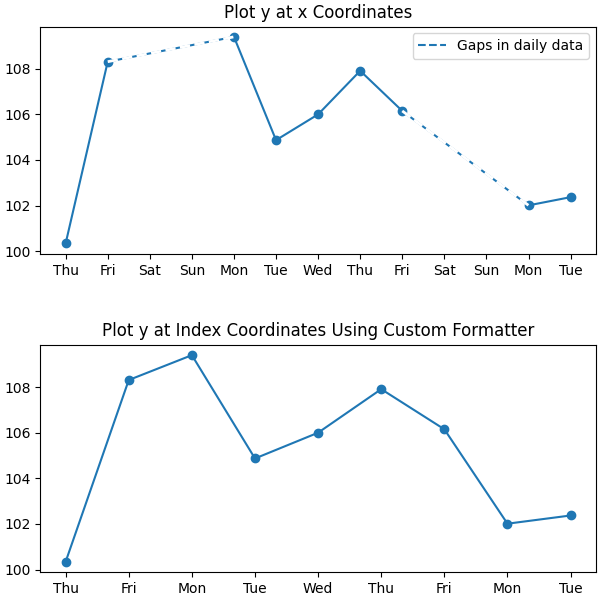
時間序列的自訂刻度格式器#
當繪製每日資料時,例如金融時間序列,通常會希望省略沒有資料的日子,例如週末,以便資料以規律間隔繪製,而不會為沒有資料的日子留下額外空間。此範例示範如何使用「索引格式器」來達到所需的繪圖效果。
import matplotlib.pyplot as plt
import numpy as np

import matplotlib.cbook as cbook
from matplotlib.dates import DateFormatter, DayLocator
import matplotlib.lines as ml
from matplotlib.ticker import Formatter

# Load a structured numpy array from yahoo csv data with fields date, open, high,
# low, close, volume, adj_close from the mpl-data/sample_data directory. The
# record array stores the date as an np.datetime64 with a day unit ('D') in
# the date column (``r['date']``).
r = cbook.get_sample_data('goog.npz')['price_data']
r = r[:9]  # get the first 9 days

fig, (ax1, ax2) = plt.subplots(nrows=2, figsize=(6, 6), layout='constrained')
fig.get_layout_engine().set(hspace=0.15)

# First we'll do it the default way, with gaps on weekends
ax1.plot(r["date"], r["adj_close"], 'o-')

# Highlight gaps in daily data
gaps = np.flatnonzero(np.diff(r["date"]) > np.timedelta64(1, 'D'))
for gap in r[['date', 'adj_close']][np.stack((gaps, gaps + 1)).T]:
    ax1.plot(gap['date'], gap['adj_close'], 'w--', lw=2)
ax1.legend(handles=[ml.Line2D([], [], ls='--', label='Gaps in daily data')])

ax1.set_title("Plot y at x Coordinates")
ax1.xaxis.set_major_locator(DayLocator())
ax1.xaxis.set_major_formatter(DateFormatter('%a'))


# Next we'll write a custom index formatter. Below we will plot
# the data against an index that goes from 0, 1,  ... len(data).  Instead of
# formatting the tick marks as integers, we format as times.
def format_date(x, _):
    try:
        # convert datetime64 to datetime, and use datetime's strftime:
        return r["date"][round(x)].item().strftime('%a')
    except IndexError:
        pass

# Create an index plot (x defaults to range(len(y)) if omitted)
ax2.plot(r["adj_close"], 'o-')

ax2.set_title("Plot y at Index Coordinates Using Custom Formatter")
ax2.xaxis.set_major_formatter(format_date)  # internally creates FuncFormatter
您可以將任何其他可呼叫物件(例如實作 __call__ 的類別的執行個體)而不是將函式傳遞到 Axis.set_major_formatter 中
class MyFormatter(Formatter):
    def __init__(self, dates, fmt='%a'):
        self.dates = dates
        self.fmt = fmt

    def __call__(self, x, pos=0):
        """Return the label for time x at position pos."""
        try:
            return self.dates[round(x)].item().strftime(self.fmt)
        except IndexError:
            pass


ax2.xaxis.set_major_formatter(MyFormatter(r["date"], '%a'))

plt.show()
腳本總執行時間:(0 分鐘 1.781 秒)