注意
前往結尾下載完整的範例程式碼。
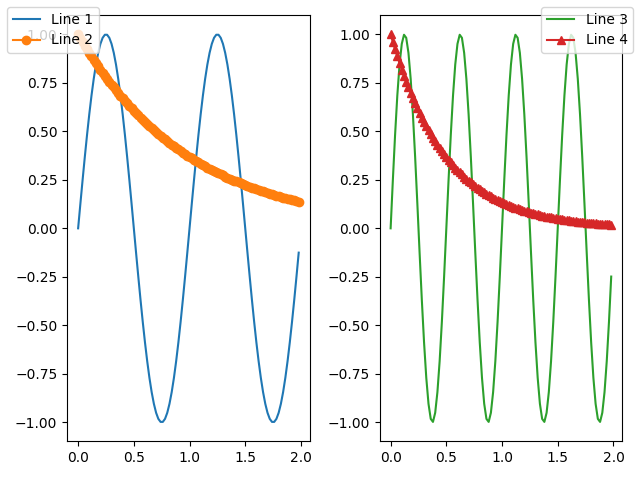
圖表圖例演示#
您可以繪製圖表中所有子軸上所有藝術家的圖例,而不是在每個軸上繪製圖例。
import matplotlib.pyplot as plt
import numpy as np

fig, axs = plt.subplots(1, 2)

x = np.arange(0.0, 2.0, 0.02)
y1 = np.sin(2 * np.pi * x)
y2 = np.exp(-x)
l1, = axs[0].plot(x, y1)
l2, = axs[0].plot(x, y2, marker='o')

y3 = np.sin(4 * np.pi * x)
y4 = np.exp(-2 * x)
l3, = axs[1].plot(x, y3, color='tab:green')
l4, = axs[1].plot(x, y4, color='tab:red', marker='^')

fig.legend((l1, l2), ('Line 1', 'Line 2'), loc='upper left')
fig.legend((l3, l4), ('Line 3', 'Line 4'), loc='upper right')

plt.tight_layout()
plt.show()
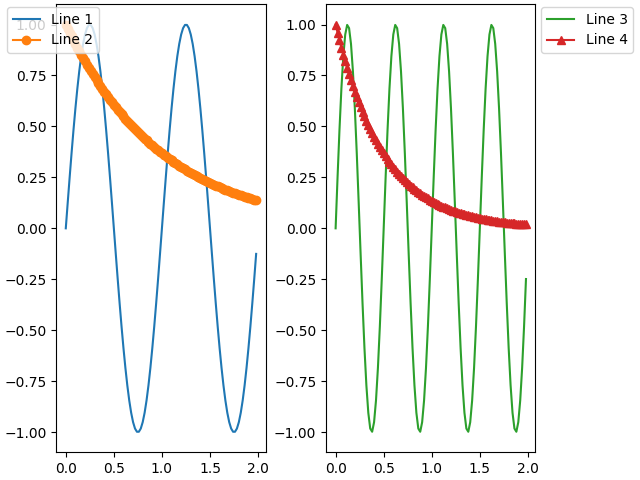
有時我們不希望圖例與軸重疊。如果您使用受限版面配置,則可以指定「右上外側」,而受限版面配置將會為圖例騰出空間。
fig, axs = plt.subplots(1, 2, layout='constrained')

x = np.arange(0.0, 2.0, 0.02)
y1 = np.sin(2 * np.pi * x)
y2 = np.exp(-x)
l1, = axs[0].plot(x, y1)
l2, = axs[0].plot(x, y2, marker='o')

y3 = np.sin(4 * np.pi * x)
y4 = np.exp(-2 * x)
l3, = axs[1].plot(x, y3, color='tab:green')
l4, = axs[1].plot(x, y4, color='tab:red', marker='^')

fig.legend((l1, l2), ('Line 1', 'Line 2'), loc='upper left')
fig.legend((l3, l4), ('Line 3', 'Line 4'), loc='outside right upper')

plt.show()
腳本的總執行時間:(0 分鐘 3.107 秒)