註解
前往結尾下載完整的範例程式碼。
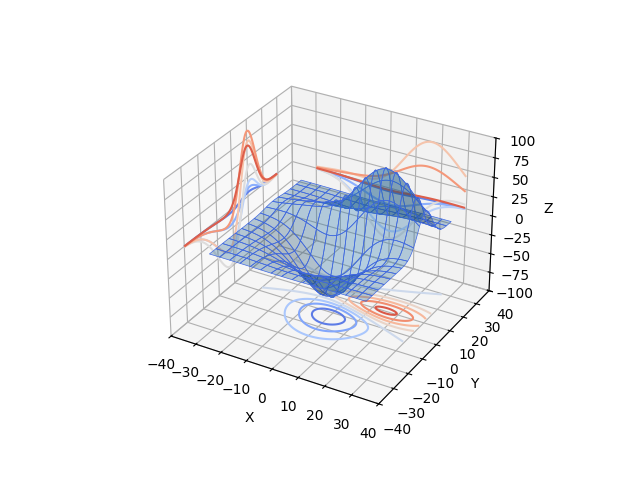
將等高線剖面投影到圖表上#
示範如何顯示 3D 曲面,同時將等高線「剖面」投影到圖表的「牆面」。請參閱將填滿的等高線投影到圖表上以取得填滿的版本。
import matplotlib.pyplot as plt

from mpl_toolkits.mplot3d import axes3d

ax = plt.figure().add_subplot(projection='3d')
X, Y, Z = axes3d.get_test_data(0.05)

# Plot the 3D surface
ax.plot_surface(X, Y, Z, edgecolor='royalblue', lw=0.5, rstride=8, cstride=8,
                alpha=0.3)

# Plot projections of the contours for each dimension.  By choosing offsets
# that match the appropriate axes limits, the projected contours will sit on
# the 'walls' of the graph.
ax.contour(X, Y, Z, zdir='z', offset=-100, cmap='coolwarm')
ax.contour(X, Y, Z, zdir='x', offset=-40, cmap='coolwarm')
ax.contour(X, Y, Z, zdir='y', offset=40, cmap='coolwarm')

ax.set(xlim=(-40, 40), ylim=(-40, 40), zlim=(-100, 100),
       xlabel='X', ylabel='Y', zlabel='Z')

plt.show()
腳本的總執行時間: (0 分 1.279 秒)