注意
跳到結尾 以下載完整範例程式碼。
重新取樣資料#
降低取樣會降低訊號的取樣率或取樣大小。在本教學中,當透過拖曳和縮放調整圖表時,訊號會降低取樣。
注意
這個範例練習 Matplotlib 的互動功能,這不會出現在靜態文件中。請在您的機器上執行此程式碼以查看互動性。
您可以複製並貼上個別部分,或使用頁面底部的連結下載整個範例。
import matplotlib.pyplot as plt
import numpy as np
# A class that will downsample the data and recompute when zoomed.
class DataDisplayDownsampler:
def __init__(self, xdata, y1data, y2data):
self.origY1Data = y1data
self.origY2Data = y2data
self.origXData = xdata
self.max_points = 50
self.delta = xdata[-1] - xdata[0]
def plot(self, ax):
x, y1, y2 = self._downsample(self.origXData.min(), self.origXData.max())
(self.line,) = ax.plot(x, y1, 'o-')
self.poly_collection = ax.fill_between(x, y1, y2, step="pre", color="r")
def _downsample(self, xstart, xend):
# get the points in the view range
mask = (self.origXData > xstart) & (self.origXData < xend)
# dilate the mask by one to catch the points just outside
# of the view range to not truncate the line
mask = np.convolve([1, 1, 1], mask, mode='same').astype(bool)
# sort out how many points to drop
ratio = max(np.sum(mask) // self.max_points, 1)
# mask data
xdata = self.origXData[mask]
y1data = self.origY1Data[mask]
y2data = self.origY2Data[mask]
# downsample data
xdata = xdata[::ratio]
y1data = y1data[::ratio]
y2data = y2data[::ratio]
print(f"using {len(y1data)} of {np.sum(mask)} visible points")
return xdata, y1data, y2data
def update(self, ax):
# Update the artists
lims = ax.viewLim
if abs(lims.width - self.delta) > 1e-8:
self.delta = lims.width
xstart, xend = lims.intervalx
x, y1, y2 = self._downsample(xstart, xend)
self.line.set_data(x, y1)
self.poly_collection.set_data(x, y1, y2, step="pre")
ax.figure.canvas.draw_idle()
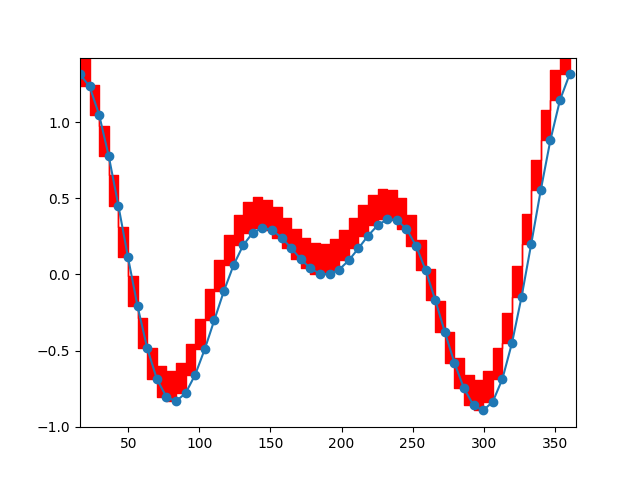
# Create a signal
xdata = np.linspace(16, 365, (365-16)*4)
y1data = np.sin(2*np.pi*xdata/153) + np.cos(2*np.pi*xdata/127)
y2data = y1data + .2
d = DataDisplayDownsampler(xdata, y1data, y2data)
fig, ax = plt.subplots()
# Hook up the line
d.plot(ax)
ax.set_autoscale_on(False) # Otherwise, infinite loop
# Connect for changing the view limits
ax.callbacks.connect('xlim_changed', d.update)
ax.set_xlim(16, 365)
plt.show()
using 52 of 1396 visible points