註解
前往結尾下載完整的範例程式碼。
嵌入定位器示範#
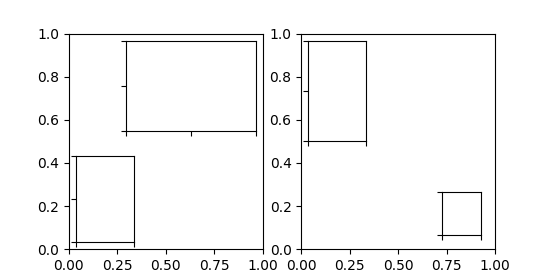
inset_locator 的 inset_axes 允許透過指定寬度和高度,以及選擇性地接受類似於 legend 的位置程式碼來輕鬆地將嵌入放置在軸的角落中。預設情況下,嵌入會透過一些點從軸偏移,這透過 borderpad 參數控制。
import matplotlib.pyplot as plt

from mpl_toolkits.axes_grid1.inset_locator import inset_axes

fig, (ax, ax2) = plt.subplots(1, 2, figsize=[5.5, 2.8])

# Create inset of width 1.3 inches and height 0.9 inches
# at the default upper right location.
axins = inset_axes(ax, width=1.3, height=0.9)

# Create inset of width 30% and height 40% of the parent Axes' bounding box
# at the lower left corner.
axins2 = inset_axes(ax, width="30%", height="40%", loc="lower left")

# Create inset of mixed specifications in the second subplot;
# width is 30% of parent Axes' bounding box and
# height is 1 inch at the upper left corner.
axins3 = inset_axes(ax2, width="30%", height=1., loc="upper left")

# Create an inset in the lower right corner with borderpad=1, i.e.
# 10 points padding (as 10pt is the default fontsize) to the parent Axes.
axins4 = inset_axes(ax2, width="20%", height="20%", loc="lower right", borderpad=1)

# Turn ticklabels of insets off
for axi in [axins, axins2, axins3, axins4]:
    axi.tick_params(labelleft=False, labelbottom=False)

plt.show()
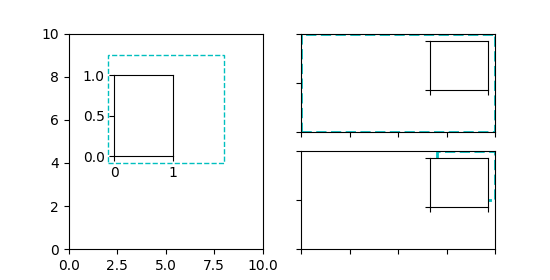
參數 bbox_to_anchor 和 bbox_transform 可用於更精細地控制嵌入位置和大小,甚至將嵌入放置在完全任意的位置。bbox_to_anchor 根據 bbox_transform 設定座標中的邊界方塊。
fig = plt.figure(figsize=[5.5, 2.8])
ax = fig.add_subplot(121)

# We use the Axes transform as bbox_transform. Therefore, the bounding box
# needs to be specified in axes coordinates ((0, 0) is the lower left corner
# of the Axes, (1, 1) is the upper right corner).
# The bounding box (.2, .4, .6, .5) starts at (.2, .4) and ranges to (.8, .9)
# in those coordinates.
# Inside this bounding box an inset of half the bounding box' width and
# three quarters of the bounding box' height is created. The lower left corner
# of the inset is aligned to the lower left corner of the bounding box.
# The inset is then offset by the default 0.5 in units of the font size.

axins = inset_axes(ax, width="50%", height="75%",
                   bbox_to_anchor=(.2, .4, .6, .5),
                   bbox_transform=ax.transAxes, loc="lower left")

# For visualization purposes we mark the bounding box by a rectangle
ax.add_patch(plt.Rectangle((.2, .4), .6, .5, ls="--", ec="c", fc="none",
                           transform=ax.transAxes))

# We set the axis limits to something other than the default, in order to not
# distract from the fact that axes coordinates are used here.
ax.set(xlim=(0, 10), ylim=(0, 10))


# Note how the two following insets are created at the same positions, one by
# use of the default parent Axes' bbox and the other via a bbox in Axes
# coordinates and the respective transform.
ax2 = fig.add_subplot(222)
axins2 = inset_axes(ax2, width="30%", height="50%")

ax3 = fig.add_subplot(224)
axins3 = inset_axes(ax3, width="100%", height="100%",
                    bbox_to_anchor=(.7, .5, .3, .5),
                    bbox_transform=ax3.transAxes)

# For visualization purposes we mark the bounding box by a rectangle
ax2.add_patch(plt.Rectangle((0, 0), 1, 1, ls="--", lw=2, ec="c", fc="none"))
ax3.add_patch(plt.Rectangle((.7, .5), .3, .5, ls="--", lw=2,
                            ec="c", fc="none"))

# Turn ticklabels off
for axi in [axins2, axins3, ax2, ax3]:
    axi.tick_params(labelleft=False, labelbottom=False)

plt.show()
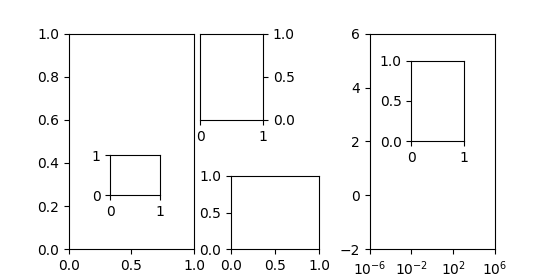
在以上範例中,已使用軸轉換與 4 元組邊界方塊,因為它大多用於指定相對於它嵌入的軸的嵌入。然而,其他用例也同樣可行。以下範例檢查其中一些用例。
fig = plt.figure(figsize=[5.5, 2.8])
ax = fig.add_subplot(131)

# Create an inset outside the Axes
axins = inset_axes(ax, width="100%", height="100%",
                   bbox_to_anchor=(1.05, .6, .5, .4),
                   bbox_transform=ax.transAxes, loc="upper left", borderpad=0)
axins.tick_params(left=False, right=True, labelleft=False, labelright=True)

# Create an inset with a 2-tuple bounding box. Note that this creates a
# bbox without extent. This hence only makes sense when specifying
# width and height in absolute units (inches).
axins2 = inset_axes(ax, width=0.5, height=0.4,
                    bbox_to_anchor=(0.33, 0.25),
                    bbox_transform=ax.transAxes, loc="lower left", borderpad=0)


ax2 = fig.add_subplot(133)
ax2.set_xscale("log")
ax2.set(xlim=(1e-6, 1e6), ylim=(-2, 6))

# Create inset in data coordinates using ax.transData as transform
axins3 = inset_axes(ax2, width="100%", height="100%",
                    bbox_to_anchor=(1e-2, 2, 1e3, 3),
                    bbox_transform=ax2.transData, loc="upper left", borderpad=0)

# Create an inset horizontally centered in figure coordinates and vertically
# bound to line up with the Axes.
from matplotlib.transforms import blended_transform_factory  # noqa

transform = blended_transform_factory(fig.transFigure, ax2.transAxes)
axins4 = inset_axes(ax2, width="16%", height="34%",
                    bbox_to_anchor=(0, 0, 1, 1),
                    bbox_transform=transform, loc="lower center", borderpad=0)

plt.show()
腳本的總執行時間:(0 分鐘 1.906 秒)