注意事項
移至末尾以下載完整的範例程式碼。
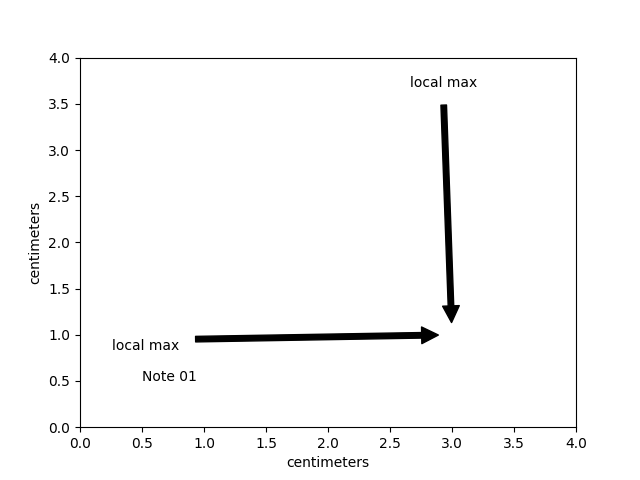
使用單位進行註解#
此範例說明如何使用公分刻度圖建立文字和箭頭註解。
此範例需要 basic_units.py
from basic_units import cm

import matplotlib.pyplot as plt

fig, ax = plt.subplots()

ax.annotate("Note 01", [0.5*cm, 0.5*cm])

# xy and text both unitized
ax.annotate('local max', xy=(3*cm, 1*cm), xycoords='data',
            xytext=(0.8*cm, 0.95*cm), textcoords='data',
            arrowprops=dict(facecolor='black', shrink=0.05),
            horizontalalignment='right', verticalalignment='top')

# mixing units w/ nonunits
ax.annotate('local max', xy=(3*cm, 1*cm), xycoords='data',
            xytext=(0.8, 0.95), textcoords='axes fraction',
            arrowprops=dict(facecolor='black', shrink=0.05),
            horizontalalignment='right', verticalalignment='top')


ax.set_xlim(0*cm, 4*cm)
ax.set_ylim(0*cm, 4*cm)
plt.show()