注意
前往結尾下載完整範例程式碼。
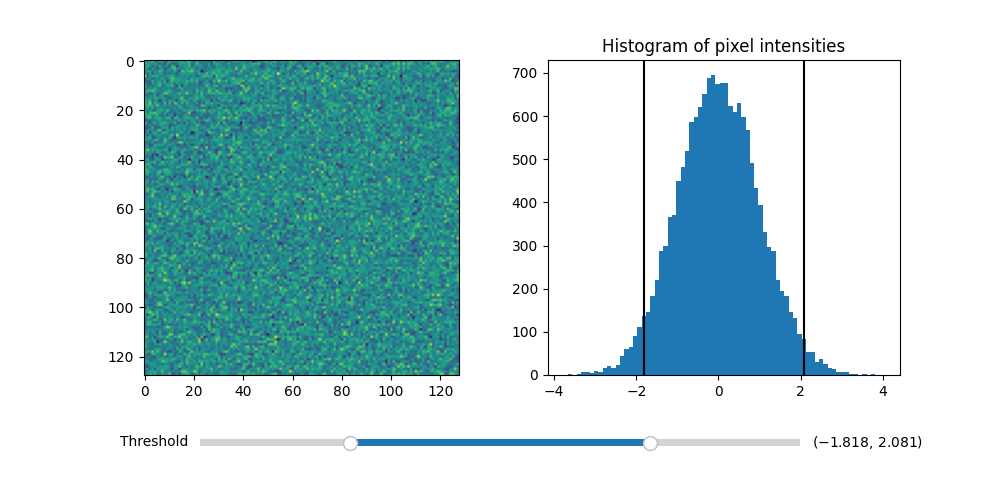
使用範圍滑桿調整影像縮放#
使用 RangeSlider 小工具來控制影像的閾值處理。
RangeSlider 小工具的使用方式與 widgets.Slider 小工具類似。主要區別在於 RangeSlider 的 val 屬性是一個浮點數元組 (lower val, upper val),而不是單個浮點數。
請參閱 滑桿,以取得使用 Slider 控制單個浮點數的範例。
請參閱 將滑桿對齊離散值,以取得 Slider 對齊離散值的範例。
import matplotlib.pyplot as plt
import numpy as np

from matplotlib.widgets import RangeSlider

# generate a fake image
np.random.seed(19680801)
N = 128
img = np.random.randn(N, N)

fig, axs = plt.subplots(1, 2, figsize=(10, 5))
fig.subplots_adjust(bottom=0.25)

im = axs[0].imshow(img)
axs[1].hist(img.flatten(), bins='auto')
axs[1].set_title('Histogram of pixel intensities')

# Create the RangeSlider
slider_ax = fig.add_axes([0.20, 0.1, 0.60, 0.03])
slider = RangeSlider(slider_ax, "Threshold", img.min(), img.max())

# Create the Vertical lines on the histogram
lower_limit_line = axs[1].axvline(slider.val[0], color='k')
upper_limit_line = axs[1].axvline(slider.val[1], color='k')


def update(val):
    # The val passed to a callback by the RangeSlider will
    # be a tuple of (min, max)

    # Update the image's colormap
    im.norm.vmin = val[0]
    im.norm.vmax = val[1]

    # Update the position of the vertical lines
    lower_limit_line.set_xdata([val[0], val[0]])
    upper_limit_line.set_xdata([val[1], val[1]])

    # Redraw the figure to ensure it updates
    fig.canvas.draw_idle()


slider.on_changed(update)
plt.show()
腳本的總執行時間:(0 分鐘 1.517 秒)